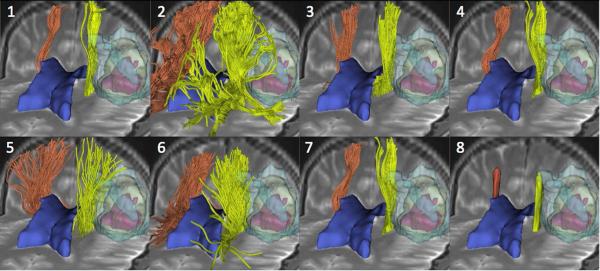
Figure 2. Patient 1, tractography results.
The mosaic image shows 3D anterior views of the pyramidal tract reconstructed by the eight tractography teams on the patient 1 dataset. Each view presents the tracts (yellow: tumor side; orange: contralateral side) overlaid on an axial and a coronal T2-weighted image, along with 3D surface models of the tumor (light yellow), necrosis (pink), edema (light blue) and lateral ventricles (dark blue). The teams are identified by a number, from 1 to 8, in the top left corner of each view.

