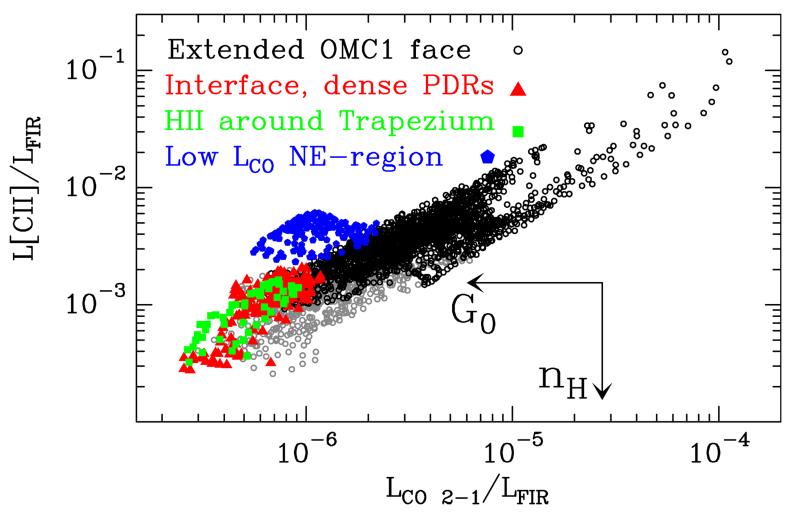
Figure 12.
Same as Fig. 11 but for L[C ii]/LFIR versus LCO 2–1/LFIR. The blue pentagons represent lines of sight of low L(CO) and high− L[C ii]/LFIR ratios (up to ~5000) at the northeast of the map, see Figures 8(c) and 8(e). Arrows show the approximate directions of increasing G0 and increasing nH expected from PDR models (e.g., Kaufman et al. 1999; Stacey et al. 2010).

