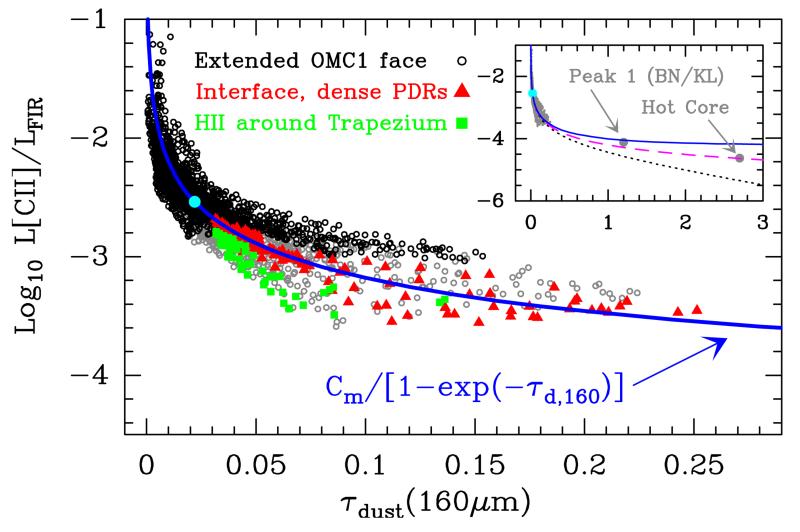
Figure 15.
Observed L[C ii]/LFIR ratios as a function of the 160 μm dust opacity. The different template regions are defined in Section 3.2. The inset panel shows an extension to higher dust opacity positions toward BN/KL. The blue continuos, magenta dashed, and black dotted curves show models of constant I[C ii]/B(Td) emission for different assumptions of the [C ii] emission location with respect to the cloud dust emission: [C ii] in the foreground surface (as in OMC 1), mixed C+ gas and grains, and embedded [C ii] sources behind the cloud respectively (see sketch in Figure 16). Models are defined to intercept the median L[C ii]/LFIR and τd,160 values of the map (cyan dot).

