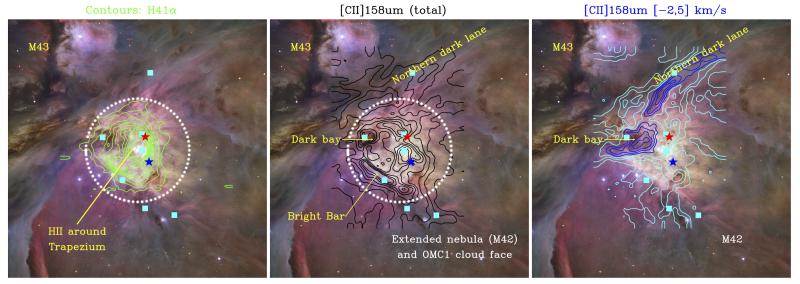
Figure 2.
Color-composite visible image of the Orion Nebula (M42) taken with the ACS instrument on board the Hubble Space Telescope (HST). The assigned colors are: red and orange for [S ii] and Hα, blue for B, and green for V filters respectively (Robberto et al. 2013). (Left): Green contours show the integrated intensity (W) of the H41α recombination line (from 3 to 21 K km s−1 in steps of 2 K km s−1). The white dotted 200″ (0.4 pc) radius circle is centered on θ1 Ori C, the brightest star of the Trapezium. We define the “extended cloud face” component to lie outside this circle. Middle: Black contours show the total [C ii] 158 μm integrated intensity (vLSR=−30 to +30 km s−1 with W from 0 to 1300 K km s−1 in steps of 150 K km s−1). Right: [C ii] “blue-shifted streamer” (emission from vLSR=−2 to +5 km −1) with W from 0 to 60 K km s1 (cyan) and from 80 to 140 K km s1 (blue), all in steps of 20 K km s−1. This emission coincides with the Northern dark lane and with the Dark bay seen in visible-light images of the Nebula. The Orion hot core in the BN/KL region and Orion S positions are indicated by red and blue stars respectively. The positions where line spectra have been extracted (shown in Figure 3) are indicated by cyan squares.

