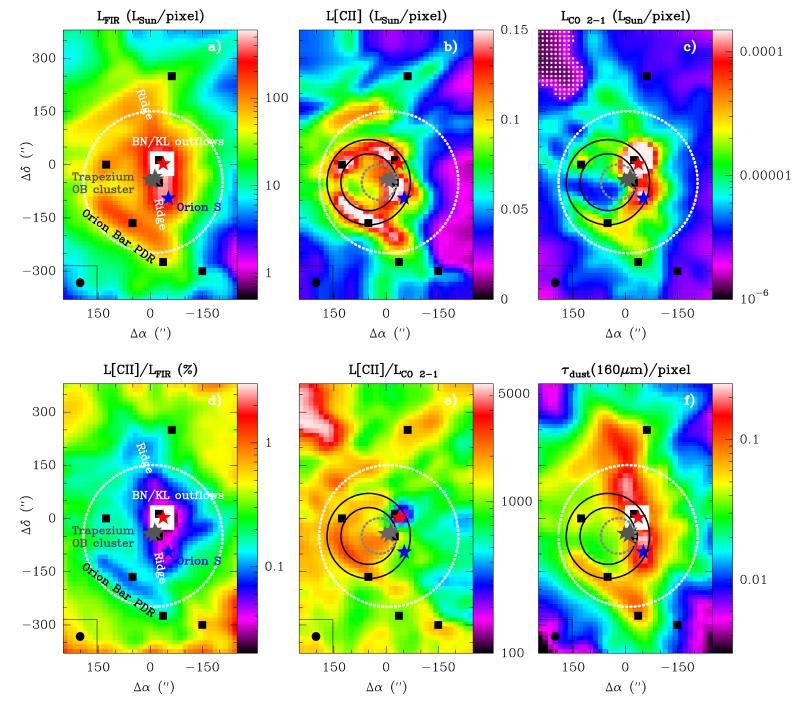
Figure 8.
Luminosity and dust opacity per pixel maps toward OMC1 convolved to 25″ resolution. (a) LFIR map (G0 ≃ 200 LFIR/L☉ per pixel, see footnote 11), (b) L[C ii], (c) LCO 2–1 (from Berné et al. 2014), (d) L[C ii]/LFIR in %, (e) L[C ii]/LCO 2–1, and (f) dust opacity at 160 μm from SED fits. The white squares in panel (c) represent positions of low LCO 2–1 and high L[C ii]/LCO 2–1 ratios (up to ~5000) in panel (e) see also Figure 11f. The different circles and regions are defined in Section 3.2. The black squares indicate the positions of the spectra shown in Figure 3. The white square areas in the central BN/KL region indicate positions where the Herschel photometric observations are saturated.

