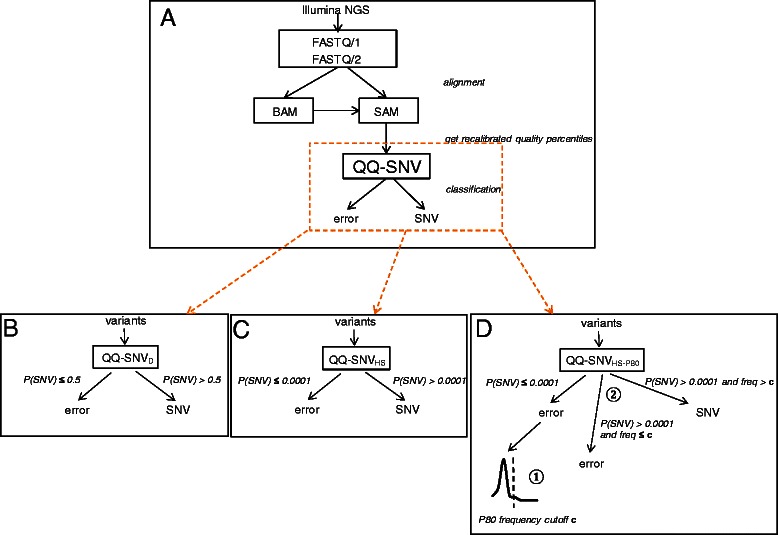
Fig. 1.

QQ-SNV variant calling. Schematic view of QQ-SNV variant calling methodology starting from Illumina NGS data. a QQ-SNV workflow b QQ-SNVD c QQ-SNVHS d QQ-SNVHS-P80, 80th percentile (P80) of the QQ-SNVHS distribution of “error” frequencies was used as frequency cutoff to decrease the number of false positives obtained with QQ-SNVHS
