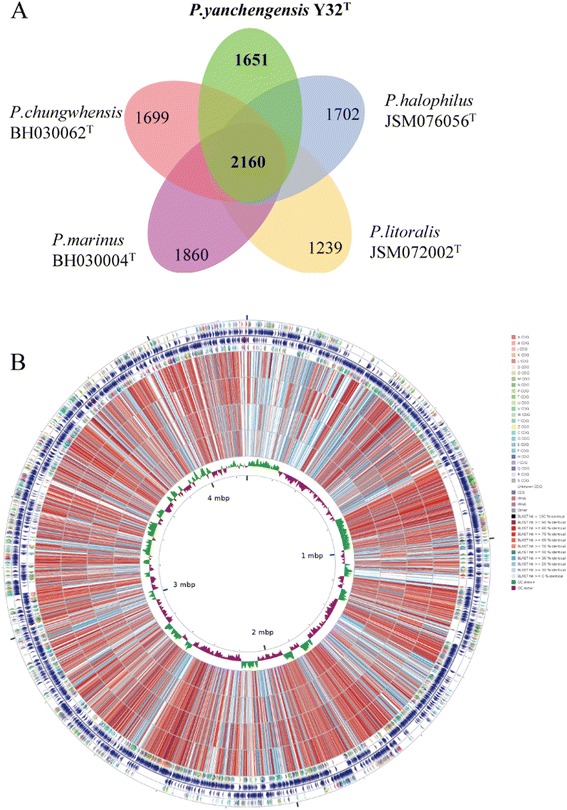
Fig. 3.

Comparative genomic analysis of the genus Pontibacillus. a The flower plot shows the numbers of species-specific genes found in each genome of each species (in the petals) and the core orthologous gene number (in the center) of Pontibacillus. b Comparison map of strain P. yanchengensis Y32T and the other four sequenced Pontibacillus strains. From outside to inside: rings 1, 4 show protein-coding genes colored by COG categories on the forward/reverse strand, respectively; rings 2, 3 represent genes on the forward/reverse strand, respectively; rings 5, 6, 7, 8 denote the CDS vs CDS BLAST results of P. marinus BH030004T, P. chungwhensis BH030062T, P. halophilus JSM076056T, and P. litoralis JSM072002T, respectively; ring 9 shows the GC skew
