Fig. 2.

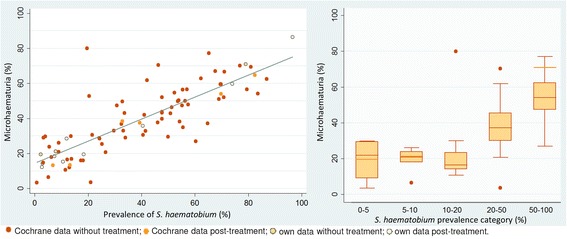
Average microhaematuria over S. haematobium prevalence from all surveys as scatter plot and box plot. Light-orange lines in the box plot refer to data from our three surveys (two in Côte d’Ivoire, one in Chad)

Average microhaematuria over S. haematobium prevalence from all surveys as scatter plot and box plot. Light-orange lines in the box plot refer to data from our three surveys (two in Côte d’Ivoire, one in Chad)