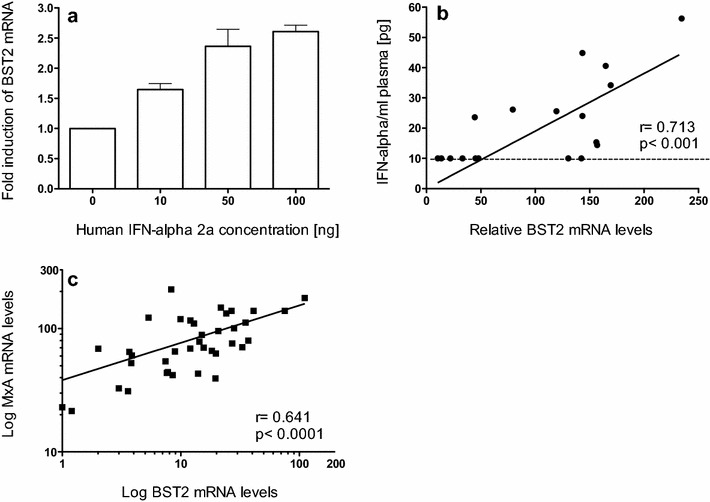
Fig. 3.

BST2 mRNA induction by type I interferon. a Fold induction of relative BST2 mRNA in PBMC from three uninfected rhesus macaques after stimulation with human Interferon Alpha A (Alpha 2a) for 16 h. Data are expressed as fold increase over baseline after normalization to pre-treatment values. Error bars represent standard deviation, b relative mRNA copies of BST2 in PBMC (shown in copy numbers per 100 copies of GAPDH) are illustrated in relation to plasma IFN-alpha levels from blood samples of 18 uninfected rhesus macaques 24 h after inoculation of replication incompetent adenovirus or fowl pox vectors. The black dashed line indicates the detection limit of the ELISA and c whole blood MX1 mRNA levels correlate with BST2 mRNA determined in 38 SIVmac251 infected rhesus macaques at 24 wpi. Relative mRNA levels are depicted as log-transformed copy numbers per 100 copies of GAPDH. Each data point represents one animal. Regression line is shown; r, Spearman’s correlation coefficient; p, p value
