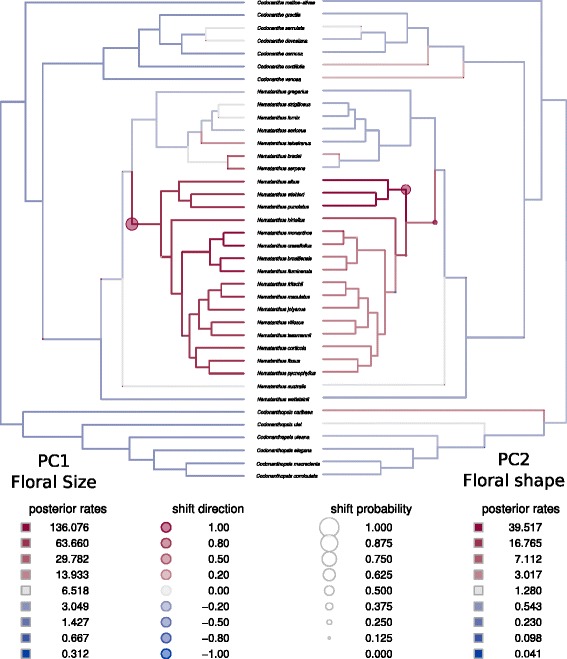
Fig. 3.

Posterior comparisons of rate of morphological trait evolution in the CCN group. Hue and size of circles at branches denote posterior support for a rate shift at the indicated branch. Larger and redder circles suggest higher posterior support for an upturn in evolutionary rate (see Eastman et al. 2011). Branches in the phylogeny are colored such that rates not deviant from the median are shaded gray; rates below (or above) the median are shaded blue (or red). Rates corresponding to each hue are indicated in the legend, as well as shift probabilities and directions
