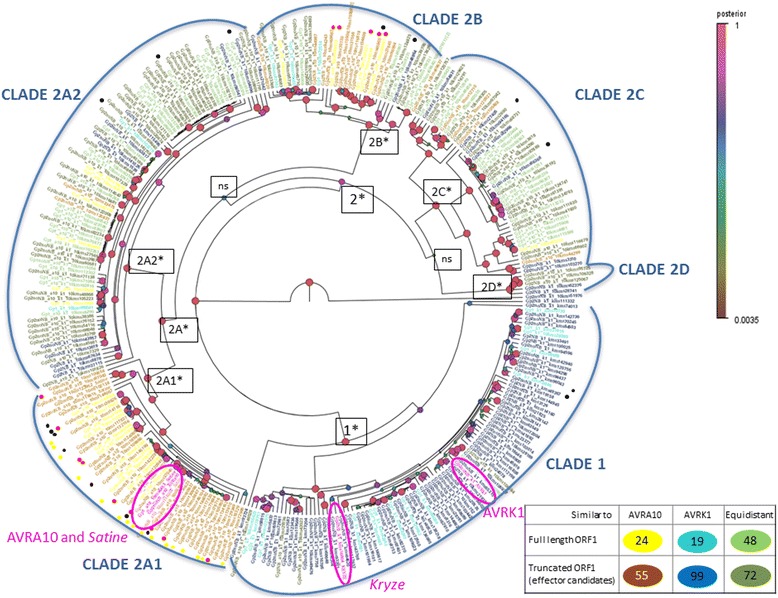
Fig. 4.

Phylogenetic tree of full length and truncated sequences homologous to AVRK1 or AVRA10 calculated using Bayesian method. Circles on nodes represent posterior probability (*significant nodes with a posterior probability >75 %). Colours represent homology to either AVRK1, AVRA10 or both, and differentiate between sequences corresponding to full length ORF1 or truncated sequences (AVR/effector candidates). Red and black dots indicate proteins expressed in haustoria or/and hyphae, respectively. Yellow dots indicate proteins putatively expressed in haustoria, with one significant peptide and a peptide just below the identity score threshold
