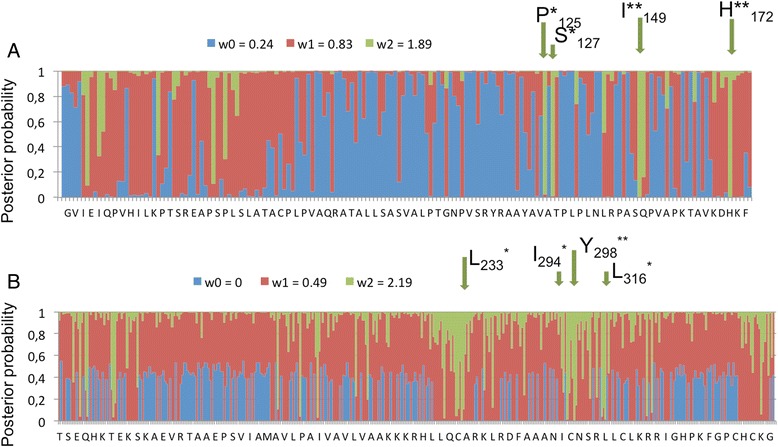
Fig. 5.

Identification of sites under positive selection of AVRK1 homologues as identified under both M3 (Naive Empirical Bayes, NEB) and M8 (Bayes Empirical Bayes, BEB) models. a truncated sequences and b full-length sequences. The vertical axis represents posterior probabilities for sites with different ω ratios (dN/dS) along the sequence. Positively selected sites (ω > 1) are highlighted on top of the graph. *: p > 0.95, **:p > 0.99 (as reported in the M3 model). w0, w1 and w2 are the three ω estimated values in the M3 model
