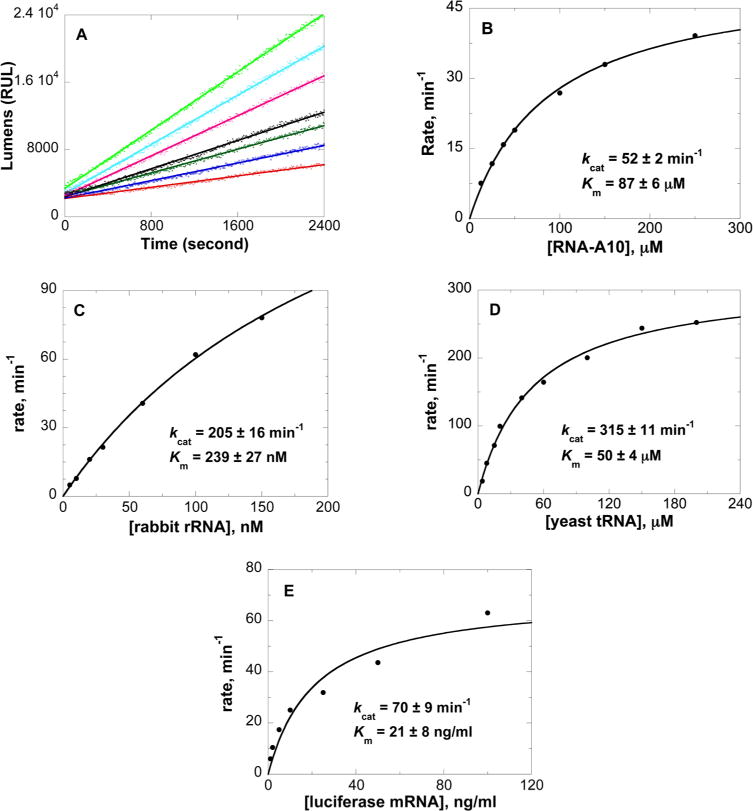
Figure 6.

Continuous assay kinetics of saporin L3 Ala14Cys in 100 mM Tris (pH 7.7). Panel A shows initial rate slopes (lumens per second) with saporin L3 Ala14Cys with increasing levels of RNA-5,7-A10 (5′-CGCGAGAGCG-3′) as a substrate. Panel B shows the fit of the kinetic data to the Michaelis–Menten equation. Panels C–E show the kinetic curve fits for saporin L3 A14C catalysis of rabbit rRNA, yeast tRNA, and luciferase mRNA, respectively. The average molecular weight of the tRNA from brewer’s yeast used from calculating Km is approximately 25 kDa.
