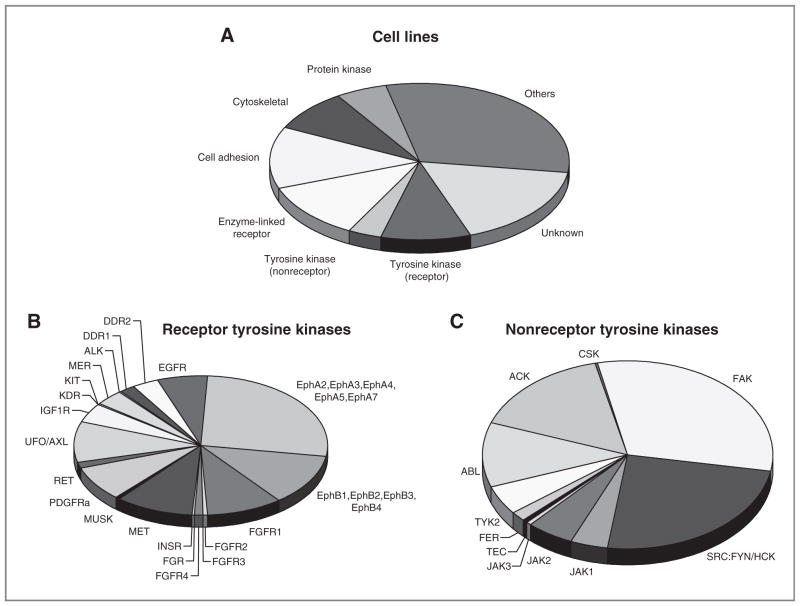
Figure 1.
Identification of tyrosine kinases in 10 sarcoma cell lines. A, distribution of phosphoprotein types. Each observed phosphoprotein was assigned a protein category from the PhosphoSite ontology. The numbers of unique proteins in each category, as a fraction of the total, are represented by the wedges in the pie. Distribution of spectral counts among receptor tyrosine kinases (B) or nonreceptor tyrosine kinases (C).

