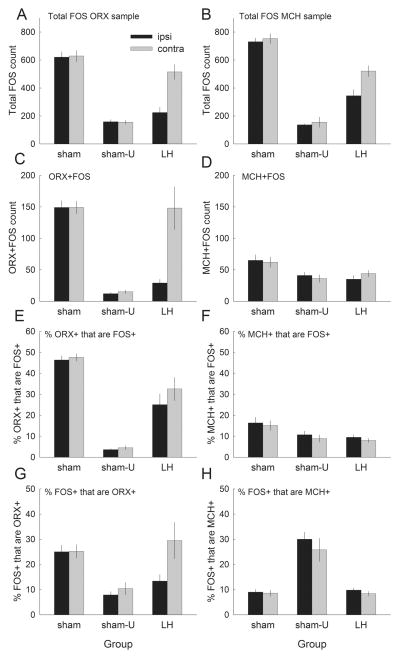
Fig. 8.
Summary hypothalamic cell counts in experiment 2. (A and B) Counts of cells in the lateral hypothalamus (LH) that stained positive for FOS (either single-labeled or double-labeled) from sections also stained for ORX or MCH, respectively. (C and D) Counts of cells that double-labeled for FOS and either ORX or MCH, respectively. (E) The percentages of all cells that labeled for ORX that also labeled for FOS; (F) the percentages of all cells that labeled for MCH that also labeled for FOS. (G and H) The percentages of all FOS-positive cells that also labeled for ORX or MCH, respectively. The bars indicate mean ± SEM counts in sham-lesioned rats that were tested with a light previously paired with food (group sham, n = 12) or with a light previously unpaired with food (group sham-U, n = 6), or in rats with unilateral orexin-saporin lesions of LH (group LH, n = 8). The black bars (Ipsi) show counts in the hemisphere in which the orexin-saporin or sham lesion of LH was made; and gray bars (Contra) show counts in the other hemisphere.

