
Figure 5.
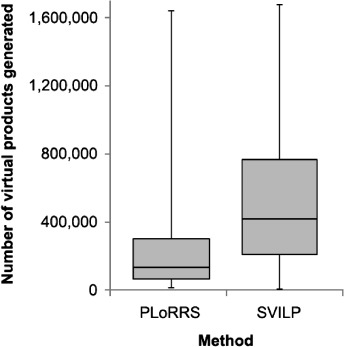
Box and whisker plots showing the distributions of the number of virtual products generated across the forty targets. The left-hand plot gives the distribution when using the PLoRRS method and the right-hand plot gives the distribution when using SVILP without PLoRRS. Box and whisker plots represent a five-number summary of a numerical set: the three horizontal lines making up the box mark the lower quartile, median and upper quartile of the set, and the whiskers extend to the maximum and minimum of the set.