
Figure 11.
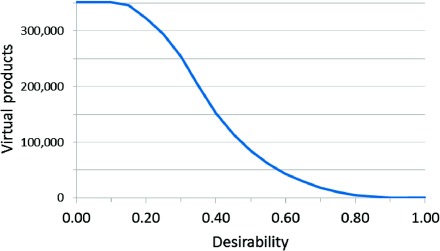
Line graph showing the number of virtual products as a higher desirability cut-off is used for filtration. Figures averaged over three representative targets (EGFr, COX-2 and P38).
Official websites use .gov
A
.gov website belongs to an official
government organization in the United States.
Secure .gov websites use HTTPS
A lock (
) or https:// means you've safely
connected to the .gov website. Share sensitive
information only on official, secure websites.
Line graph showing the number of virtual products as a higher desirability cut-off is used for filtration. Figures averaged over three representative targets (EGFr, COX-2 and P38).