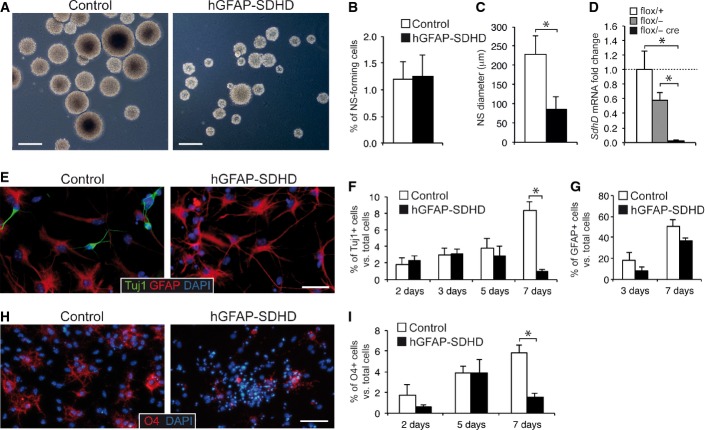
Figure 2. Effects of mitochondrial dysfunction on subventricular zone neural stem cells.
- A Bright-field images of neurospheres obtained from SVZ neural stem cells of P15 control and hGFAP-SDHD mouse brains. Scale bars: 500 μm.
- B, C Neurosphere (NS) forming efficiency (B) and core diameter (C) in cultures grown from SVZ of P15 control and hGFAP-SDHD mice (n = 6 cultures/mice for each genotype).
- D Quantitative RT–PCR detection of SdhD expression levels in SVZ neurospheres of wild-type (flox/+) and mutant (flox/−, and flox/− cre) mice (n = 3–4 mice on each group).
- E Immunofluorescence detection of the neuronal marker Tuj1 in SVZ neural stem cell-derived adherent cultures from P15 control or hGFAP-SDHD brains. Nuclei were counterstained with DAPI. Scale bar: 25 μm.
- F Number of Tuj1+ neurons generated in SVZ neural stem cell adherent cultures in vitro for several days (n = 8 cultures/mice for each genotype).
- G Number of GFAP+ astrocytes present in adherent cultures of SVZ neurospheres illustrating the resistance of glial cells to the loss of mitochondrial function (n = 5 independent cultures).
- H Immunofluorescence detection of the oligodendrocyte marker O4 in SVZ neural stem cell-derived adherent cultures from P15 control or hGFAP-SDHD brains. Nuclei were counterstained with DAPI. Scale bar: 25 μm.
- I Number of O4+ neurons generated in SVZ neural stem cell adherent cultures in vitro for several days (n = 5–7 cultures/mice for each genotype). See also Fig EV5.
Data information: Data are presented as mean ± SEM. *P ≤ 0.05. The two-tailed Student’s t-test was applied.

