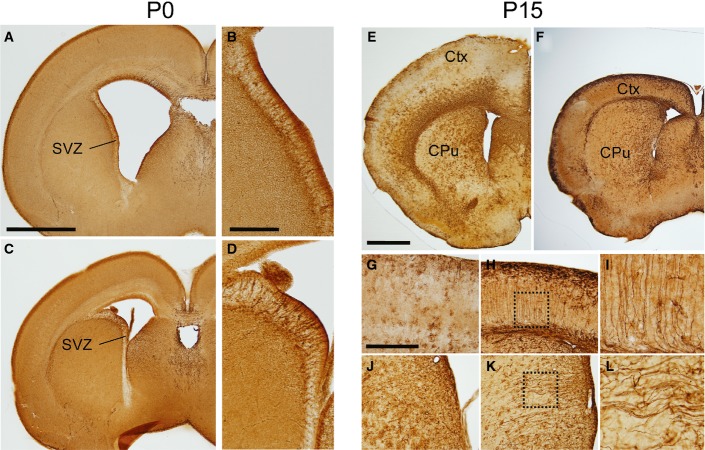
A–L Brain sections of newborn (P0; A–D) and postnatal (P15; E–L) control (A, B, E, G, J) and hGFAP-SDHD littermates (C, D, F, H, K, I, L) immunostained with GFAP antibody. The images in (B) and (D) are higher magnifications of the subventricular zone in (A) and (C), respectively. Images in (G, H) are higher magnifications of the cortex, and images in (J, K) of caudate-putamen areas shown in (E, F), respectively. Insets in (H) and (K) are higher magnified in (I) and (L), respectively. Scale bars: 1 mm (A, C, E, F), 200 μm (B, D), 500 μm (G, H, J, K). Ctx: cortex; CPu: caudate putamen; SVZ: subventricular zone.

