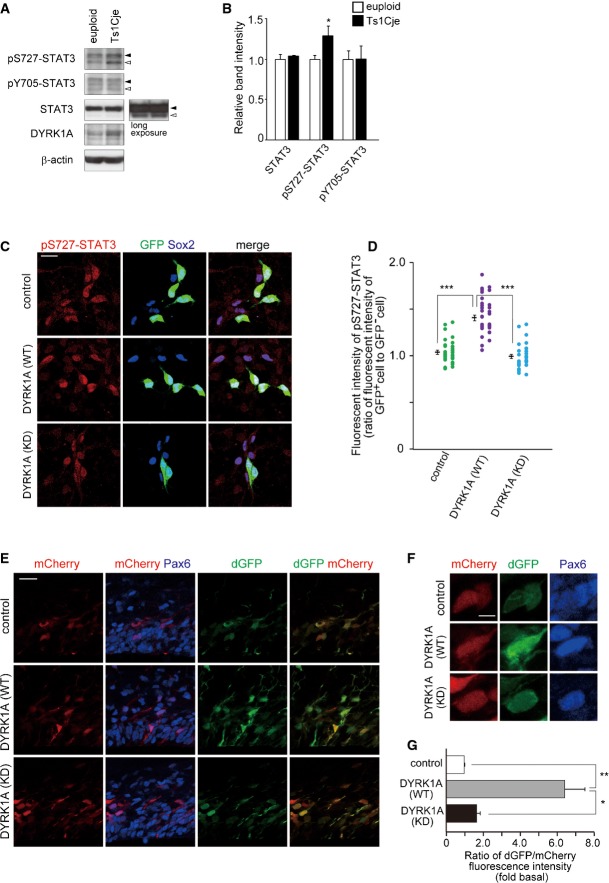
Figure 5. Overexpression of DYRK1A results in an increase in STAT activity and Ser727 phosphorylation levels of STAT3.
- A, B Whole-cell lysates of the P0 neocortex of Ts1Cje mice and euploid littermates were subjected to immunoblotting with the indicated antibodies. The band intensities quantified are plotted in (B) (mean ± SEM, n = 4 for euploid and n = 3 for Ts1Cje). *P < 0.05 by a two-tailed Student’s t-test.
- C, D Plasmid expressing DYRK1A was electroporated, together with the GFP-expressing plasmid, in E16 embryos. Neocortical cell cultures were prepared immediately after electroporation, and the cells at DIV2 were immunostained with antibodies against GFP, pS727-STAT3, and Sox2. Representative images are shown in (C). Immunofluorescence intensity of pS727-STAT3 (D) in individual GFP-positive cells and that in nearby GFP-negative cells were measured, and the ratio of the intensity values is plotted. Data are obtained from two independent experiments. ***P < 0.001 by a two-tailed Welch’s t-test.
- E–G DYRK1A-expressing plasmid was electroporated, together with the GF1L-dGFP reporter construct and mCherry-expressing plasmid, in E16 embryos. The E17 brain sections were stained with antibodies against GFP and Pax6. Images around the VZ are shown in (E). Magnified images of the cells are shown in (F). The ratio of the fluorescence intensity of dGFP to that of mCherry (G) in the soma of individual cells expressing mCherry is shown as mean ± SEM (n = 3 embryos). *P < 0.05, **P < 0.01 by a two-tailed Student’s t-test.
Data information: Scale bars: 20 μm (C, E), or 5 μm (F).

