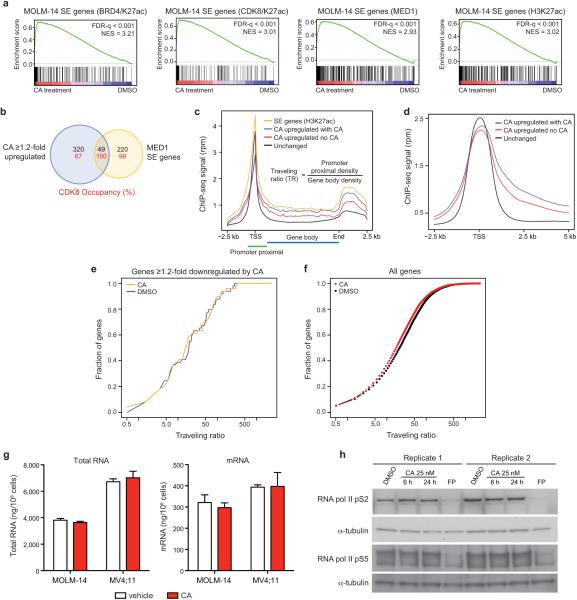
Extended Data Fig 6. CA disproportionately affects expression of SE genes in MOLM-14 cells.
(a) GSEA plots showing positive enrichment of SE-associated genes (SE genes), defined by ChIP-seq signal for indicated factors, with 3 h CA treatment in MOLM-14 cells (differential expression vs. DMSO controls). (b) Venn diagram showing the overlap between SE genes and genes upregulated ≥1.2-fold upon 3 h CA treatment in MOLM-14 cells (“CA upregulated genes”). Numbers in red indicate the percentage of CDK8-occupied genes (peak within ±5kb of the gene). (c,d) RNA pol II ChIP-seq metagene profile plots of unchanged genes (black), SE-associated genes (SE genes, yellow), CA upregulated genes with vehicle treatment (no CA; red), and CA upregulated genes with 6 h CA treatment (with CA; blue). (e) Cumulative distribution plot of RNA pol II traveling ratio (TR) after treatment with CA (25 nM, 6 h) or vehicle across genes ≥1.2-fold downregulated by CA after 3 h (1.16-fold, p = 0.31, Kolmogorov-Smirnov test) and (f) across all genes (1.21-fold, p < 2.2 × 10⁻¹⁶, Kolmogorov-Smirnov test). (g) CA does not significantly change the total amount of RNA or mRNA in MOLM-14 or MV4;11 cells (mean ± s.e.m., n=3 biological replicates, experiment performed once) after treatment with CA (25 nM, 3 h). (h) Global levels of RNA pol II pS2 or RNA pol II pS5 do not change after treatment with CA by immunoblot analysis. Flavopiridol (FP) was used at 300 nM as a positive control (experiment performed twice, full scan in Supplementary Figure 1).

