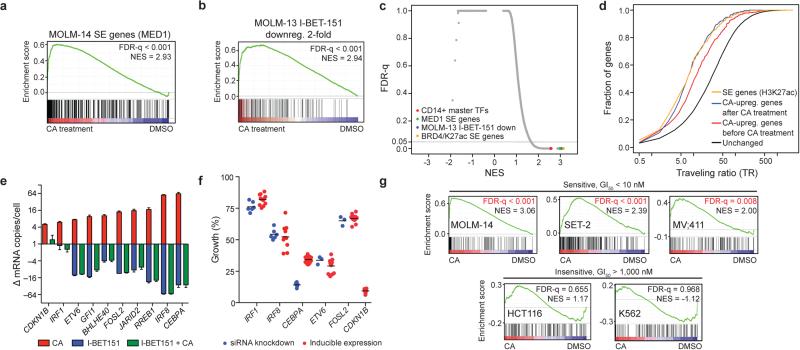
Figure 3. CA disproportionately increases transcription of SE-associated genes.
(a-b) GSEA plots show that genes upregulated upon 3h CA treatment of MOLM-14 cells are significantly enriched in (a) MOLM-14 SE-associated genes (SE genes) and (b) genes downregulated by IBET-151 ≥2-fold in MOLM-13 cells. Red bars in b indicate H3K27ac SE genes in MOLM-14 cells in GSEA leading edge (22 genes, Fisher's exact test, p = 1.2 × 10⁻³). (c) Scatterplot of false discovery rate (FDR-q) versus normalized enrichment score (NES) for indicated gene sets evaluated by GSEA (n = 3,867), including C2 of MSigDB. (d) Cumulative distribution plots of RNA pol II TR. (e) Change in mRNA copy number/cell of selected SE genes after 3 h treatment (red and blue bars) or after 6 h I-BET151 treatment with CA treatment for the final 3 h (green bar) (mean ± s.e.m., n=3 biological replicates, one of two experiments shown). (f) Effect of change in expression of selected SE genes on MOLM-14 cell growth (mean ± s.e.m., with n=3 biological replicates for siETV6 and siFOSL2 and 6 for other siRNA knockdowns, 24 for FLAG-CEBPA and 12 for other inducible expressions, one of 2-6 experiments shown). (g) GSEA of SE genes in CA-treated cells. Regions of CDK8 and H3K27Ac co-enrichment identify SE genes in each cell line.

