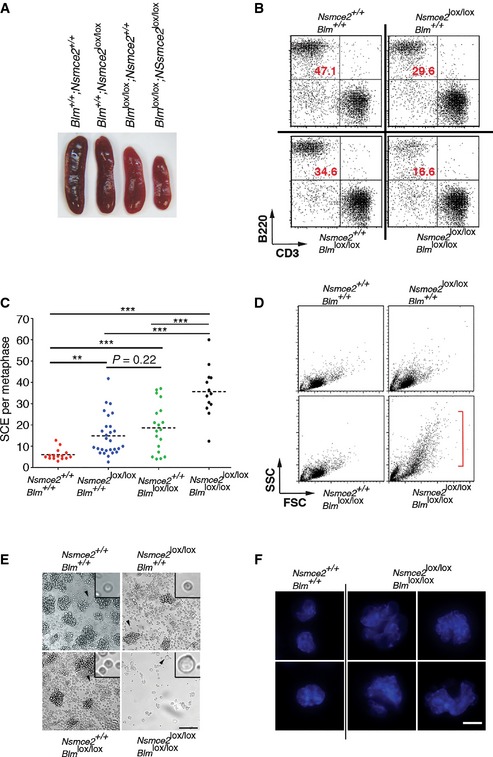
Representative pictures of the spleens from 2‐month‐old CD19+/Cre animals of the indicated genotypes.
Numbers of B and T cells from 2‐month‐old CD19+/Cre animals of the indicated genotypes evaluated by flow cytometry (B220: B‐cell marker; CD3: T‐cell marker).
SCE events per metaphase on B cells obtained from CD19+/Cre animals of the indicated genotypes, 72 h after being stimulated in vitro with LPS. **P < 0.01, ***P < 0.001.
Analysis of forward (FSC) and side (SSC) scatter parameters of B cells obtained from CD19+/Cre animals of the indicated genotypes, 48 h after being stimulated in vitro with LPS. The emergence of bigger cells is noticeable on cells lacking both BLM and NSMCE2.
Representative images of B‐cell cultures of the indicated genotypes 48 h after being stimulated in vitro with LPS. Insets provide a magnified view of an individual cell (arrowhead) for better comparison of the observed differences in cell size. Scale bar, 100 μm.
Examples of the types of nuclei found on Blm and Nsmce2 double‐mutant B cells (compared with wild‐type B cells), in cells obtained from (E). DAPI was used to stain DNA. Whereas wt nuclei are regular in size, double‐mutant cells invariably presented enlarged, multilobulated, and irregular nuclei. Scale bar, 2.5 μm.