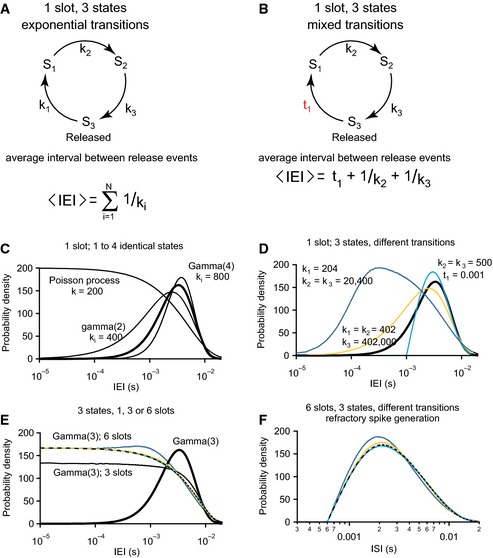
Model of the vesicle release/refill cycle at a single release site (“slot”) based on a Markov model with N states, in this example N = 3. The transitions into state i occurs as Poisson process with rate k
i. If all N rates are identical, the intervals between release events follow a gamma distribution with form factor N (see C).
One of the Poisson transitions is replaced by a transition that takes a fixed time, as it would occur when active clearance was replaced by clearance through diffusion.
The probability density function of IEIs for release site models with 1–4 states and identical transitions. The rate constants are given in s−1. For three states (thick line), k
i = 600/s. The memoryless Poisson process (N = 1) contributes much more very short IEIs. The transition rates were adapted to obtain an average release rate of 200/s in all cases.
The IEI distribution of a three‐state‐cycle with identical transitions follows a gamma distribution with form factor 3 (thick line). If the first one of the transitions becomes much faster, the IEI distribution shifts toward gamma with form factor 2 (orange), if also a second transition becomes faster, the single remaining slow transition is speed limiting and the IEI distribution shifts toward a Poisson distribution (dark blue). When one of the transitions is replaced by a fixed waiting time t1, the IEI distribution shifts in the other direction (cyan). As no intervals shorter than t1 are now possible, the probability density concentrates toward longer intervals.
As release events from more than one release site are combined, very short IEIs can occur and the result resembles a mixture of a Poisson process and a gamma process (thin continuous black line: three states, dashed line six states) even if each individual release site produces gamma(3)‐distributed events. This blurs the clear differences observed for a single release site (compare to D, corresponding simulations in identical color code). Data are generated with the same relative rate differences as in (C), but all rates are scaled to obtain an average release rate of 200/s from the one, three or six release sites combined.
The refractory spike generation further transforms the probability density functions. Intervals below the absolute refractory period no longer occur, and the distributions are deformed toward longer intervals.