Average forward masking data of SGNs from AP‐2μ
fl/fl
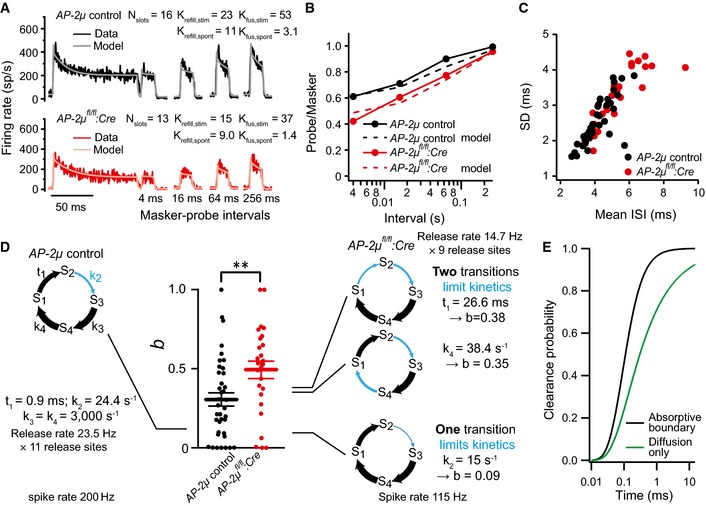
:Cre:GFP (n = 10, black) and AP‐2μ control (n = 15, red) mice and fits of biophysical model (gray and pink lines) to study RRP release and replenishment at AZs of IHCs. A stimulus complex consisting of a 100‐ms masker stimulus, a silent interval of 4/16/64/256 ms, and a 15‐ms probe (both at the characteristic frequency, 30 dB above threshold) was presented at 2 Hz.
Recovery of onset response analyzed as ratio of probe and masker response (number of spikes during first 15 ms) and prediction (dashed lines) derived from the model fit shown in (A).
Analysis of interspike intervals (ISIs) of spikes during the last 25 ms (adapted) responses to tone burst presented at characteristic frequency, 30 dB above threshold. SGNs in AP‐2μ
fl/fl
:Cre:GFP mice (red) on average showed larger mean (P < 0.001, Wilcoxon rank‐sum test) and standard deviation (SD, P < 0.01, Wilcoxon rank‐sum test) of ISIs.
Relative contribution, b, of the gamma process to the spike time distribution and schematic representation of models of the functional cycle of a release site. The states S1 through S4 represent conditions such as “cleared”, “docked”, “primed”, and “fused”. The size of the connecting arrows symbolizes the speed of the transitions, with thick arrows indicating fast steps. For the simulations, it is assumed that eleven such release sites constitute one synapse; however, the exact number has no influence on the conclusions drawn. The output of the model is a sequence of release‐driven spike events. The statistics of interspike intervals was analyzed, and the parameter b, the fraction of gamma‐process contributions, was determined. A ˜40% reduction in the release rate from 200 Hz (left model) to 115 Hz can be caused by very different changes to the model's kinetics; three examples are shown. If a single step takes up most of the cycle time (bottom example), the parameter b is small. If the mutation slows a previously rapid transition, to distribute the delays in the cycle to two different transitions, an increase in b is the result, as observed in the experimental data.
Comparison of predicted clearance of protein from the membrane at the active zone when modeled as free diffusion (green) or as a combination of diffusion and active removal (or conversion) of proteins at a boundary 50 nm from the fusion locus (black). Note that in both cases, clearing only occurs after an initial delay of ˜20 μs. Clearance without any removal or conversion (green line) is markedly slower, with only ˜90% of material cleared after 14 ms (see also
Appendix Fig S5).