-
A, B
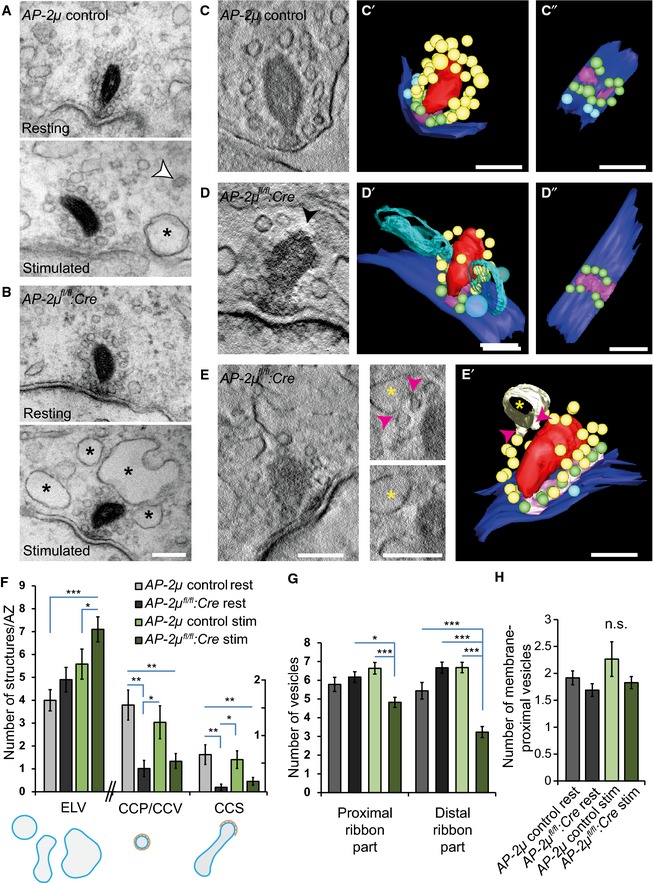
Electron micrographs of random ultrathin sections of ribbon synapses of resting and K+‐stimulated (50 mM for 15 min) AP‐2μ control (A) and AP‐2μ
fl/fl
:Cre:GFP (B) p14‐17 IHCs. Coated structures (white arrowhead) are present in resting and stimulated AP‐2μ control IHCs but clearly reduced in AP‐2μ
fl/fl
:Cre:GFP
IHCs near synaptic ribbons. A strong accumulation of ELVs was observed near AZs of stimulated IHCs of both genotypes (black asterisks). A depletion of vesicles at the membrane‐distal part of the ribbon was found in stimulated AP‐2μ
fl/fl
:Cre:GFP
IHCs. Analysis was performed on random sections of ribbon‐occupied AZs derived from several IHCs per genotype: AP‐2μ control rest n
random section = 27; AP‐2μ control stim n = 25; AP‐2μ
fl/fl
:Cre:GFP rest n = 25; and AP‐2μ
fl/fl
:Cre:GFP stim n = 56. 1–2 mice were used per condition. Scale bars, 100 nm.
-
C–E
Electron tomography of stimulated AP‐2μ control (C) and AP‐2μ
fl/fl
:Cre:GFP (D, E) IHC synapses corroborated the depletion of ribbon‐associated synaptic vesicles (black arrowhead in D; also see representative virtual sections (C, D, E, black arrowhead in D points to the membrane‐distal ribbon that lacks ribbon‐associated vesicles.) and models reconstructed from tomograms, C', D', E' (C'' and D'', top view on the AZ without ribbons); red: ribbon; magenta: presynaptic density; blue: AZ membrane; yellow: ribbon‐associated SVs; green: membrane‐proximal SVs; and light blue > 70 nm: ELVs). Budding of non‐coated vesicles (magenta arrowheads, E, E') from an ELV (yellow asterisk) was observed in AP‐2μ
fl/fl
:Cre:GFP
IHCs near the membrane‐distal end of the ribbon. Scale bars, 100 nm.
-
F
Quantification of perisynaptic non‐SV membrane organelles in random sections: in addition to coated structures such as clathrin‐coated pits at the membrane and coated vesicles (largely absent in AP‐2μ
fl/fl
:Cre:GFP
IHCs), we quantified ELVs in random sections, defined as non‐coated endocytic intermediates round or polymorphic in shape and > 70 nm in diameter. CCP/CCV and CCS are depicted in a different scale compared to ELVs.
-
G, H
(G) Fewer ribbon‐associated SVs but (H) normal number of membrane‐proximal SVs in random sections from stimulated AP‐2μ
fl/fl
:Cre:GFP
IHCs.
Data information: Data are presented as mean ± SEM. Statistics in (F‐H) was done on random sections using one‐way ANOVA followed by Tukey's multiple comparisons in Igor Pro software. Statistical significance is indicated by *(
< 0.001).