
Figure 9. AP‐2μ is required for normal sorting and abundance of otoferlin in IHCs.
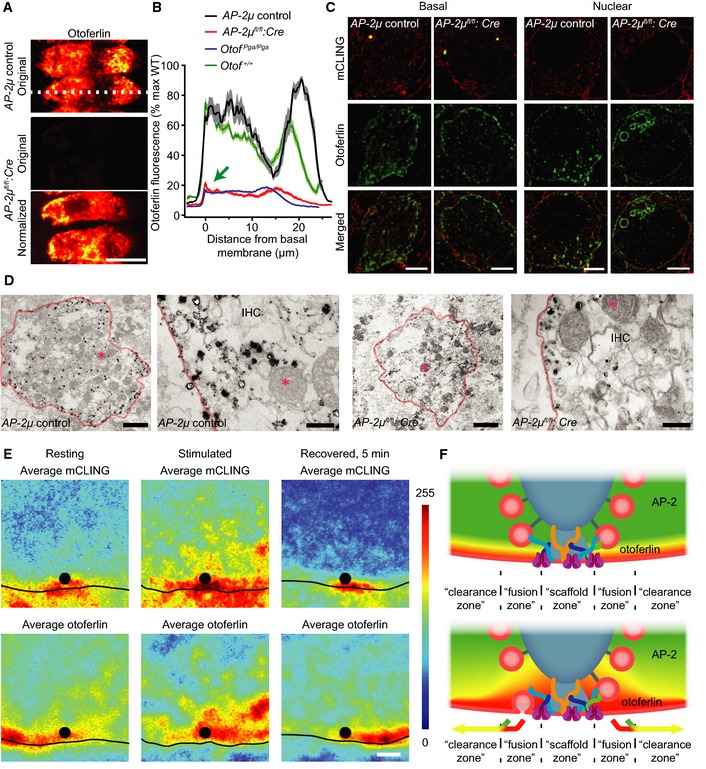
- Disruption of AP‐2μ causes a reduction and mislocalization of otoferlin. Maximal projections of confocal sections of otoferlin‐immunolabeled resting AP‐2μ control (upper) and AP‐2μ fl/fl :Cre:GFP (lower two panels) IHCs that were stained and imaged in parallel under identical conditions. “Original” (middle panel) indicates images acquired with identical settings; “normalized” indicates that the image has been normalized to maximum fluorescence in order to visualize the distribution of otoferlin. The basal pole of the IHCs points left in the images. Scale bar, 10 μm.
- Average line profiles along the long axis of the IHCs (white dotted line in A) reveal a reduction in otoferlin immunofluorescence and a redistribution showing more otoferlin at the plasma membrane than intracellularly (green arrow).
- Combination of 2‐color STED (fixable fluorescent membrane marker mCLING, red; otoferlin immunofluorescence, green) and confocal (RIBEYE/CtBP2‐immunofluorescence marking synaptic ribbons in yellow) microscopy of synaptic/basal pole (left block) and non‐synaptic nuclear level (right block) of AP‐2μ control (left columns) and AP‐2μ fl/fl :Cre (right columns) IHCs, fixed after 1 min of stimulation with 65 mM K+. Data reveal large mCLING‐positive structures that probably represent ELVs at the basal level. Prominent mCLING‐ and otoferlin‐positive vacuoles were seen at the nuclear level. Mice lacking the GFP reporter were used as the green channel was used for otoferlin immunolabeling. Scale bar, 2 μm.
- Electron micrographs of resting AP‐2μ control (left block) and AP‐2μ fl/fl :Cre:GFP (right block) IHCs following pre‐embedding immunogold labeling for otoferlin. Left panels of each block show an overview of the basal area of the IHC (scale bar, 2 μm), and right panels of each block show a close‐up of the plasma membrane (scale bar, 200 nm). In both cases, a reduced number of silver‐enhanced gold grains, which preferentially reside close to the plasma membrane (indicated in orange), is apparent in AP‐2μ fl/fl :Cre:GFP IHCs. For clarity, in each image, one mitochondrium is marked by a pink asterisk.
- STED imaging of ultrathin melamine sections of AP‐2μ control IHCs showing uptaken mCLING fluorescence (top) and immunohistochemically stained otoferlin (bottom). Individual images were averaged as described for Fig 7. The cells were chemically fixed either in resting state (left, n = 19 AZs), following 1‐min stimulation by 65 mM K+ (middle, n = 16 AZs), or in recovered state, 5 min after stimulation (right, n = 22 AZs). Scale bar, 500 nm.
- Schematic of the proposed role of AP‐2 in AZ clearance. Otoferlin arriving at the AZ is speculated to be actively lateralized by interaction with AP‐2.