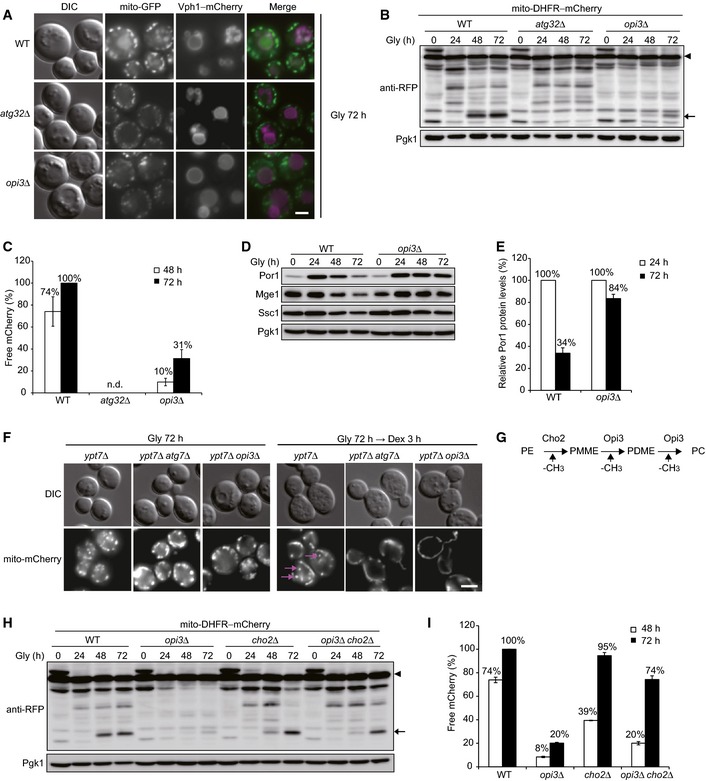
Representative images of mitochondria‐targeted GFP (mito‐GFP) and vacuole‐targeted mCherry (Vph1–mCherry) patterns. Wild‐type, atg32Δ, and opi3Δ cells were grown in glycerol medium (Gly) for 72 h and observed under a fluorescence microscope. Scale bar, 2 μm.
Wild‐type, atg32Δ, and opi3Δ cells expressing mito‐DHFR–mCherry (depicted by arrowhead) were cultured as in (A). Cells were harvested at the indicated time points and subjected to Western blotting. Generation of free mCherry (depicted by arrow) indicated transport of mitochondria to the vacuole. Pgk1 was monitored as a loading control.
The amounts of free mCherry detected in (B) were quantified at the indicated time points. The signal intensity value of free mCherry in wild‐type cells at 72 h was set to 100%. Data represent the averages of three experiments, with error bars indicating standard deviations.
Authentic mitochondrial proteins in wild‐type and opi3Δ cells cultured as in (B) were analyzed by Western blotting. Por1 is an outer membrane protein. Mge1 and Ssc1 are matrix proteins. Pgk1 was monitored as a loading control.
The Por1 protein levels analyzed in (D) were quantified at the indicated time points. The signal intensity values in wild‐type and opi3Δ cells at 24 h were set to 100%. Data represent the averages of three experiments, with error bars indicating standard deviations.
Representative images of mitochondria‐targeted mCherry (mito‐mCherry) patterns. ypt7Δ, ypt7Δ atg7Δ, and ypt7Δ opi3Δ cells grown in glycerol medium (Gly) for 72 h were shifted to fresh dextrose (Dex) medium for 3 h and observed as in (A). Mitophagosomes are depicted by arrows. Scale bar, 2 μm.
A schematic diagram of the phospholipid methylation pathway in the yeast S. cerevisiae. Cho2 and Opi3 are methyltransferases to synthesize phosphatidylcholine (PC) from phosphatidylethanolamine (PE). PMME, phosphatidylmonomethylethanolamine; PDME, phosphatidyldimethylethanolamine.
Wild‐type, opi3Δ, cho2Δ, and opi3Δ cho2Δ cells expressing mito‐DHFR–mCherry were cultured and analyzed as in (A) and (B), respectively. Pgk1 was monitored as a loading control.
The amounts of free mCherry detected in (H) were quantified as in (C). The signal intensity value of free mCherry in wild‐type cells at 72 h was set to 100%. Data represent the averages of three experiments, with error bars indicating standard deviations.