Wild‐type,
opi3Δ,
cho2Δ, and
opi3Δ
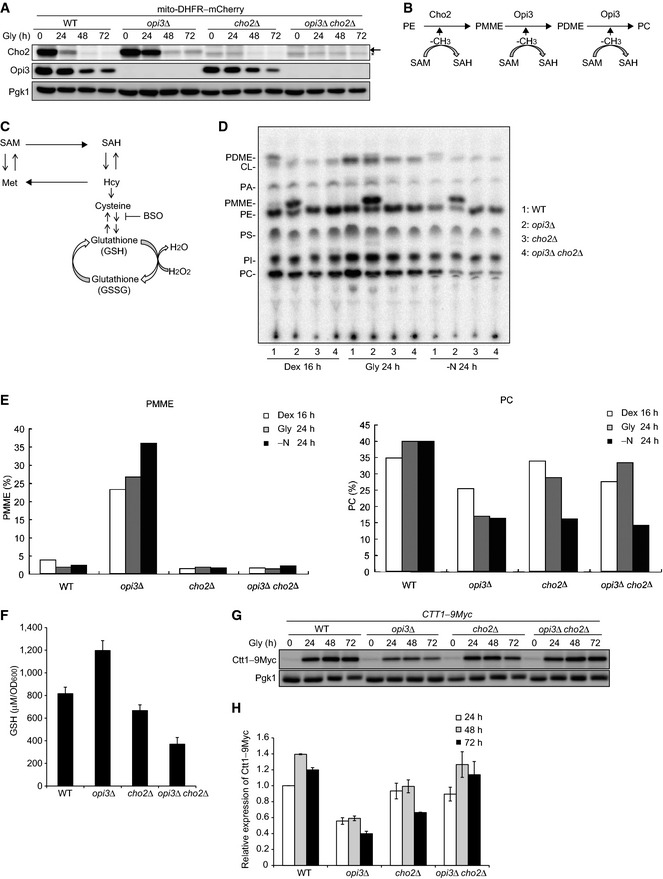
cho2Δ cells expressing mito‐DHFR–mCherry were cultured and analyzed as in Fig
1B. Cho2‐specific and Cho2‐non‐specific bands are depicted by arrow and asterisk, respectively. Pgk1 was monitored as a loading control.
A schematic diagram of PC biosynthesis from PE in budding yeast. PE, phosphatidylethanolamine; PMME, phosphatidylmonomethylethanolamine; PDME, phosphatidyldimethylethanolamine; PC, phosphatidylcholine; SAM, S‐adenosyl methionine; SAH, S‐adenosyl homocysteine (see text for details).
A schematic diagram of the transmethylation cycle and transsulfuration–GSH pathway. Hcy, homocysteine; BSO, buthionine sulfoximine (see text for details).
One‐dimensional thin‐layer chromatography (1‐D TLC) for wild‐type, opi3Δ, cho2Δ, and opi3Δ cho2Δ cells. Cells were grown in synthetic media containing dextrose (Dex) or glycerol (Gly), or subjected to nitrogen starvation (−N) in the presence of 32Pi, and collected at the indicated time points. Total cellular phospholipids were then extracted in the organic phase and separated by 1‐D TLC. CL, cardiolipin; PA, phosphatidic acid; PC, phosphatidylcholine; PDME, phosphatidyldimethyl‐ethanolamine; PE, phosphatidylethanolamine; PI, phosphatidylinositol; PMME, phosphatidylmonomethylethanolamine; PS, phosphatidylserine.
The radioactive spots of PMME and PC in (D) were quantified using densitometry. The signal intensity value of total phospholipids in each sample was set to 100%.
Wild‐type, opi3Δ, cho2Δ, and opi3Δ cho2Δ cells were grown in synthetic glycerol medium for 24 h, collected, and subjected to quantification of total cellular reduced glutathione (GSH). Data represent the averages of three experiments, with error bars indicating standard deviations.
Wild‐type, opi3Δ, cho2Δ, and opi3Δ cho2Δ cells expressing a chromosomally Myc‐tagged Ctt1, a cytosolic catalase, were cultured and analyzed as in (A). Pgk1 was monitored as a loading control.
The Ctt1–Myc protein levels analyzed in (F) were quantified at the indicated time points. The signal intensity values in wild‐type cells at 24 h were set to 1.0. Data represent the averages of three experiments, with error bars indicating standard deviations.