
Figure 7. Atg32 overexpression and choline treatment partially rescue mitophagy in opi3‐null cells.
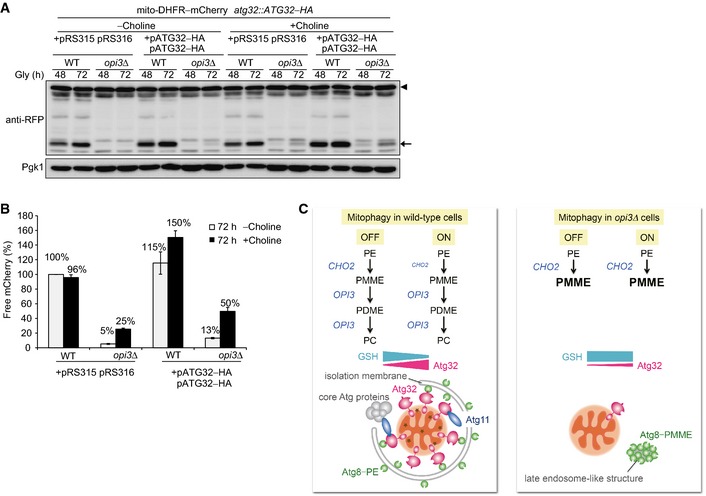
- Wild‐type and opi3Δ cells expressing mito‐DHFR–mCherry and a chromosomally encoded Atg32–HA were transformed with two Atg32–HA‐expressing plasmids or empty vectors, cultured in the presence or absence of choline, and analyzed as in Fig 1B. Generation of free mCherry (depicted by arrow) from mito‐DHFR–mCherry (depicted by arrowhead) indicated transport of mitochondria to the vacuole. Pgk1 was monitored as a loading control.
- The amounts of free mCherry detected in (A) were quantified at the 72‐h time point as in Fig 1C. The signal intensity value of free mCherry in wild‐type cells containing two empty vectors without choline treatment was set to 100%. Data represent the averages of three experiments, with error bars indicating standard deviations.
- A model for mitophagy regulation through the phospholipid methylation pathway in wild‐type and opi3‐null cells. PE, phosphatidylethanolamine; PC, phosphatidylcholine; PMME, phosphatidylmonomethylethanolamine; PDME, phosphatidyldimethylethanolamine; GSH, reduced glutathione (see text for details).