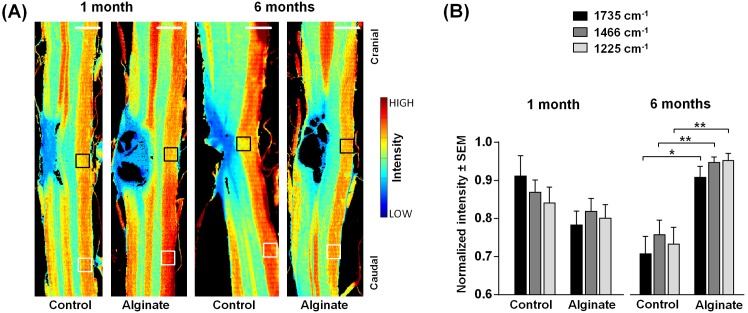
Fig 2. Analysis of the contralateral nervous tissue.
(A) Spectroscopic images showing the intensity of the band at 1735 cm-1 (νs(C = O)). They depict the distribution of lipids in control and alginate-implanted samples one and six months post-injury. Scale bar: 1 mm. (B) Intensities of the bands at 1735 cm-1, 1466 cm-1 (δ[(CH2)], also showing the distribution of lipids) and 1225 cm-1 (νas(PO2 −), showing the distribution of phospholipids) in the white matter contralateral to the lesion indicated by the black boxes in panel A normalized for each samples to the intensity in the region indicated by white boxes in panel A. For each group n = 5–6. Two-tailed t-test, *: p < 0.05, **: p < 0.01.

