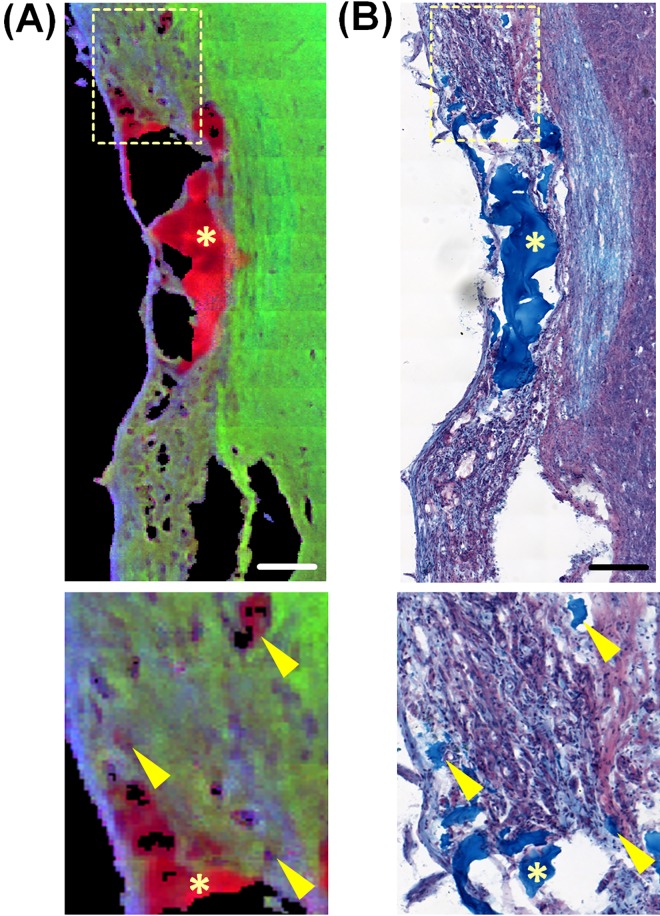
Fig 5. Distribution of alginate within the tissue six months after injury.
(A) spectroscopic RGB image, generated by combining the intensity of bands at 1420 cm-1 (alginate hydrogel–red), 1653 cm-1 (nervous tissue–green) and 1242 cm-1 (collagen—blue). (B) Alcian blue staining of a consecutive section. Scale bars: 100 μm. The boxes in A and B indicate the area of magnification. The arrowheads in the magnifications indicate small inclusions of alginate hydrogel into the tissue that colocalize in the spectroscopic image and in the staining. The asterisks indicate alginate inside large cysts.

