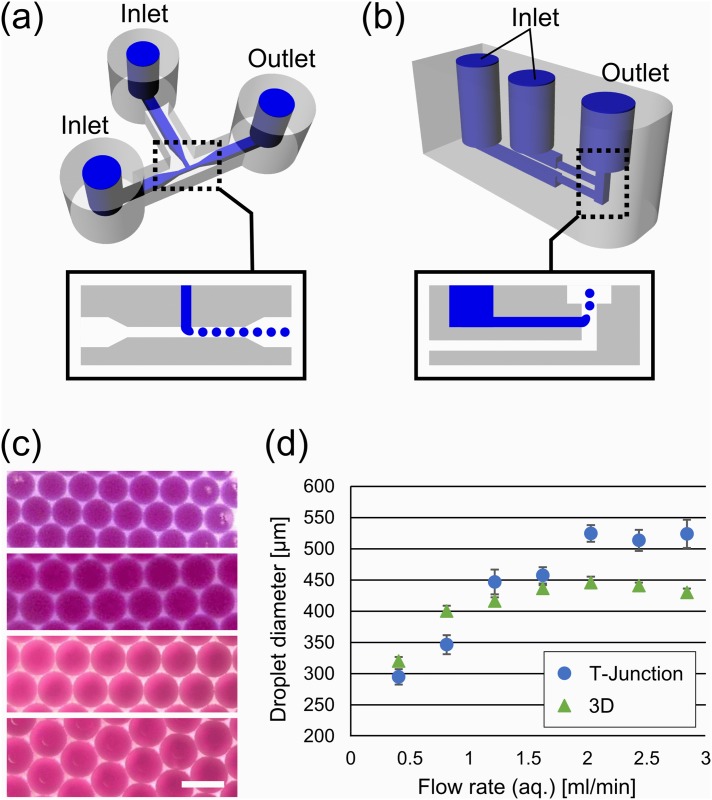
Fig 1. 3D printed droplet generators.
(A) CAD design of the T-junction device with one aqueous inputs, one oil input, and an output. Internal channel structures are illustrated in blue. Aqueous phase (indicated in blue in the inset) was introduced from the top inlet and oil phase (white) from the left. (B) The CAD design of 3D droplet generator. Aqueous phase (blue in the inset) was cut into small droplets by oil phase (white). (C) Microscopic pictures of generated droplets. Flow rates of aqueous phase are 0.4, 0.8, 1.6, and 2.4 ml/min (top to bot-tom). The top two images were from the 3D device, and the bottom ones were from the T-junction device. Scale bar: 250 μm. (D) Plot of droplet diameter as a function of the flow rate of aqueous phase. The flow rate of oil phase was fixed at 2.8 ml/min. Error bars were standard deviations.

