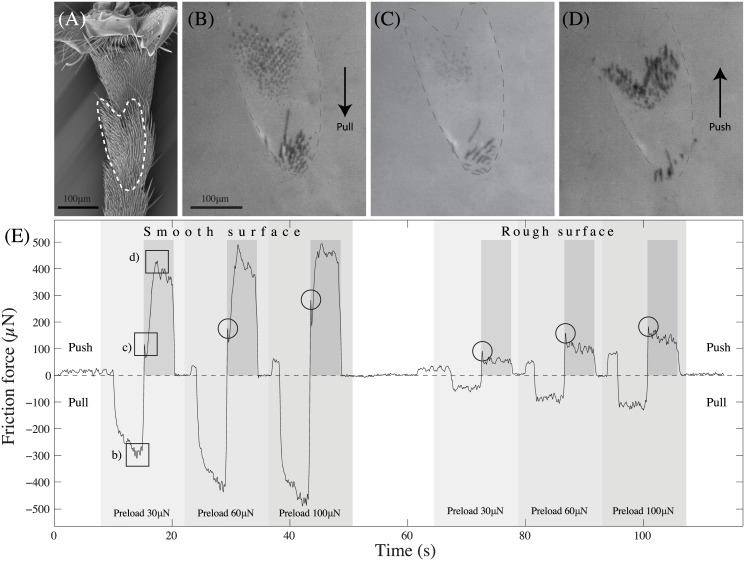
Fig 9. Typical friction force trace from tarsal hair fields against a smooth and rough surface.
(A) SEM image showing the tarsal hairs of the 3rd and 4th tarsomeres (the part in contact with the surface is outlined with a dashed line). (B) Contact area of the hairs in pulling orientation using coaxial illumination on a stereo-microscope. (C) Hairs at the point of buckling. (D) Hairs re-orientated under pushing shear forces. (E) Force trace of tarsal hairs under different preloads and shearing directions on smooth and rough surfaces. Images in sub-figures (B-D) were taken at the points marked with squares in the raw trace curve. Circles mark characteristic ‘kinks’ in the force curve indicating the buckling of the hairs. Darker shaded regions indicate the time period during which the motorised stage moved the sample in the pushing direction.

