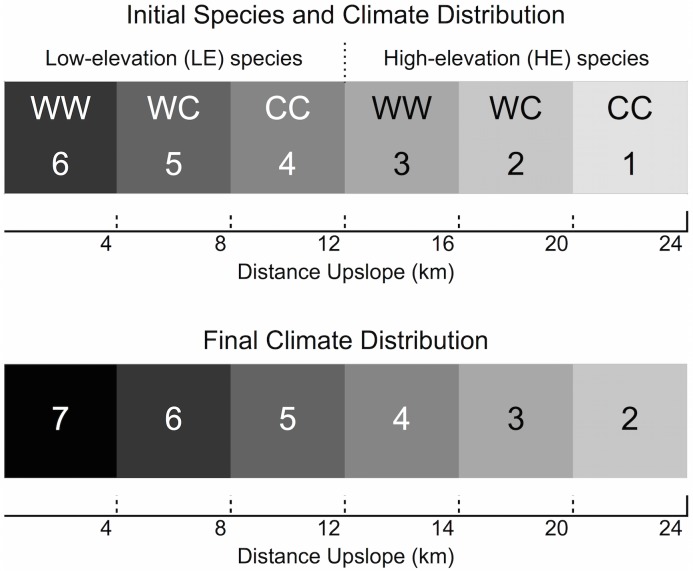
Fig 1. Initial distribution of species, genotypes, and climate across the model landscape (top).
W indicates “warm climate allele” and C “cold climate allele” shading represents the ideal climate for each genotype. Initial climates range from 6 (hottest) to 1 (coldest). Final climate distribution after the 80-year period of climate change (bottom) ranges from 7 to 2.

