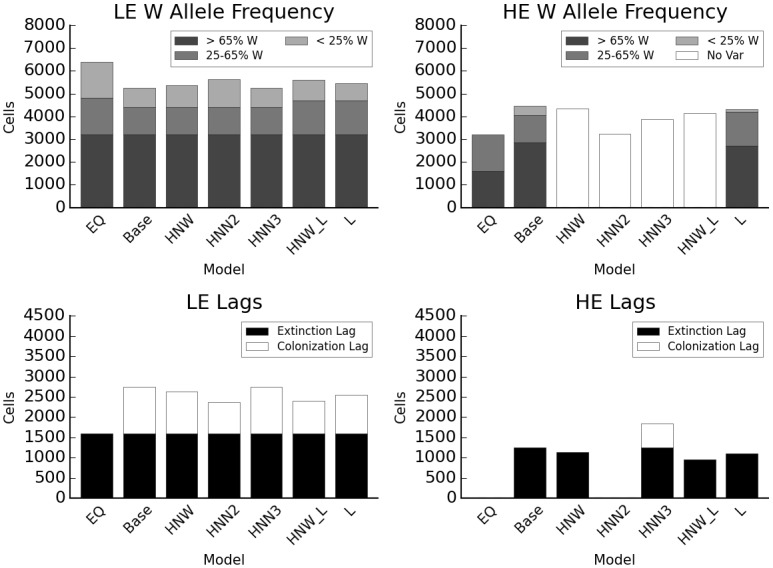
Fig 6. Interaction between genetic diversity and dispersal.

EQ: equilibrium distribution after climate change without disturbance; Base: baseline model; HNW: HE species single genotype with wide tolerance (optimum climate 2); HNN2: HE species single genotype with narrow tolerance (optimum 2); HNN3: HE species single genotype with narrow tolerance (optimum 3); HNW_L: HE species single genotype with wide tolerance (optimum 2), long dispersal; L: long dispersal. Y axis indicates total number of cells occupied, colors the genotype category based on proportion of W alleles.
