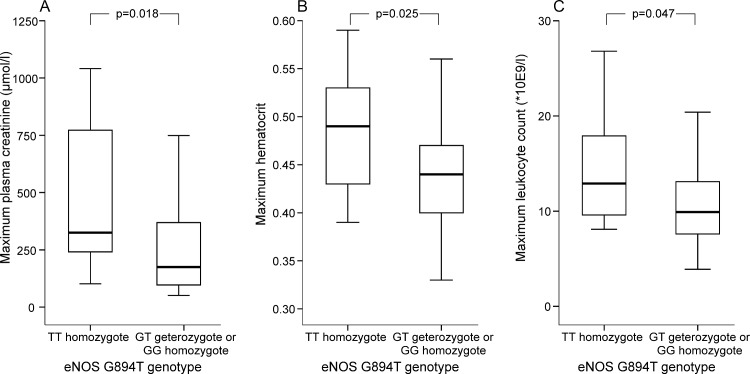
Fig 1. Box plots of the maximum plasma creatinine (A), hematocrit (B) and leukocyte count in TT-homozygotes (n = 10) and GT-heterozygotes or GG-homozygotes (n = 157) of eNOS G894T(rs1799983) polymorphism in 169 patients with PUUV infection.
Box plot illustrates median (thick line inside box), 25th and 75th percentiles (box), and range (whiskers). Extremes and outliers have been omitted from the figure.

