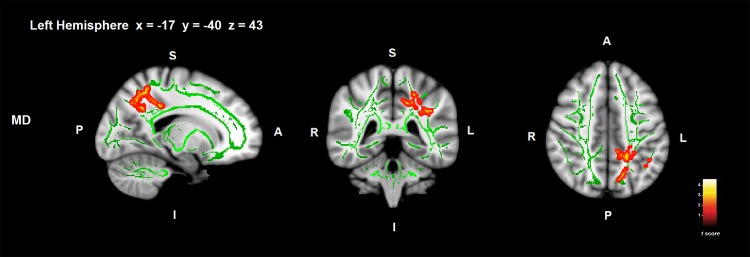
Fig 3. Correlations between ToM deficit and WM MD controlling for executive functions in PD.
Significant WM regions are shown in red-yellow; the WM skeleton is shown in green. S = superior; I = inferior; A = anterior; P = posterior. Coordinates are shown in MNI space (Montreal Neurological Institute).

