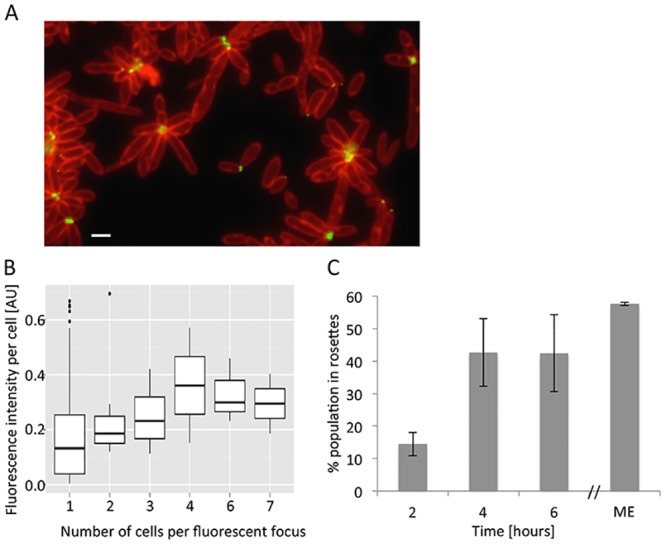
Fig 2. Polar polysaccharide at the center of rosettes.

(A) Fluorescent overlay image of membrane stained cells (red) and Alexa 488-conjugated WGA lectin (green). Scale bar corresponds to 1 μm. (B) Quantification of lectin fluorescence intensity per cell in arbitrary units [AU]. Shown is a box plot generated with the R software [28]. (C) Percent of population in rosettes at early growth stages (2, 4, and 6 hours) or in a mid-exponential (ME) culture (see Methods). Cultures for this time course were obtained as described in Methods. Error bars indicate standard deviation of two biological replicates.
