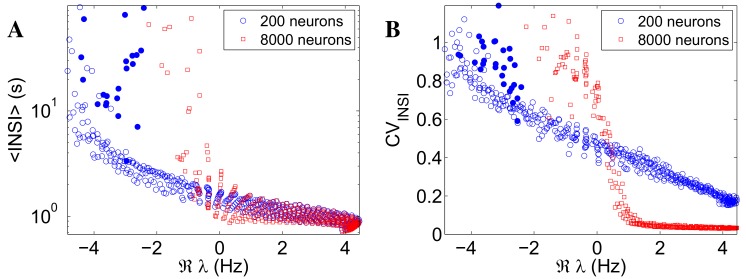
Fig 3. Stability analysis of the linearized dynamics captures most of the variability in the inter-network-spike interval (INSI) statistics.
〈INSI〉 (panel A) and CVINSI (panel B) vs the real part ℜλ of the dominant eigenvalue of the Jacobian of the linearized dynamics, for two networks that are pointwise identical in the excitation-inhibition plane, except for their size (circles: 200 neurons, as in Fig 2; squares: 8000 neurons). The data points almost collapse on 1-D curves when plotted as functions of ℜλ, leading effectively to a “quasi one-dimensional” representation of the INSI statistics in the (wexc, winh)-plane. The region in which the INSIs are neither regular (CVINSI ∼ 0) nor completely random (CVINSI ≃ 1), as typically observed in experimental data, shrinks for larger networks. The filled circles mark a null imaginary part ℑλ.

