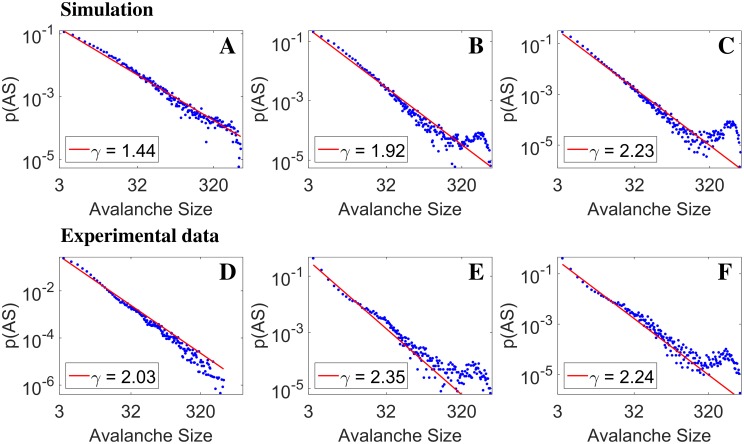
Fig 6. Avalanche size distribution: simulations vs ex-vivo data.
Panels A-C: mean-field simulations, with fixed inhibition winh = 1. and increasing excitation (wexc = 0.9, 0.94, 1). The distributions are well fitted by power-laws; panel B and C clearly show the buildup of ‘bumps’ in the high-size tails, reflecting the increasing contribution from network spikes and quasi-orbits in that region of the distribution. Panels D-F from ex-vivo data, different ∼40-minute segments from one long recording; power-laws are again observed, although fitted exponents cover a smaller range; in panels E and F, bumps are visible, similar to model findings. The similarity between the theoretical and experimental distributions could reflect changes of excitatory/inhibitory balance in time in the experimental preparation. Since all the three simulations lay on the left of or just on the bifurcation line (white line in Fig 2), the shown results are compatible with the experimental network operating in a slightly sub-critical regime.

