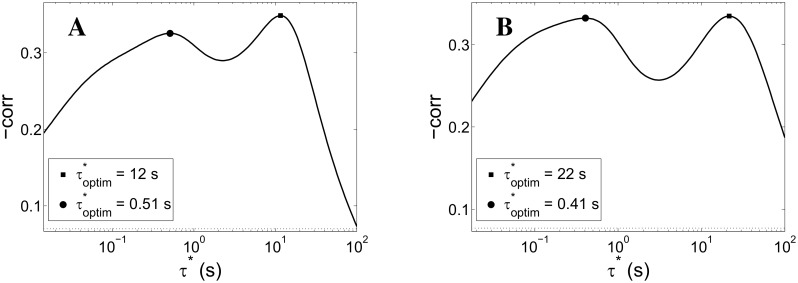
Fig 9. Slow time-scales inference procedure on simulation data with STD and spike-frequency adaptation.
Correlation between low-pass filtered network activity f (see Eq 19) and the size of the immediately subsequent network spike plotted against the time-scale τ* of the low-pass integrator. In this case, the mean-field model includes, besides short-term depression (STD), a mechanism mimicking spike-frequency adaptation. Panel A: spike-frequency adaptation with characteristic time τ SFA = 15 s. Panel B: τ SFA = 30 s. In both cases the correlation presents a STD-related peak at around τ* ≃ 500 ms (τ STD = 800 ms), consistently with Fig 7. The peaks at higher τ*s, found respectively at 12 and 22 s, in accordance with what is reported in the plot legends and in the main text, roughly preserve the ratio of the corresponding τ SFA values.

