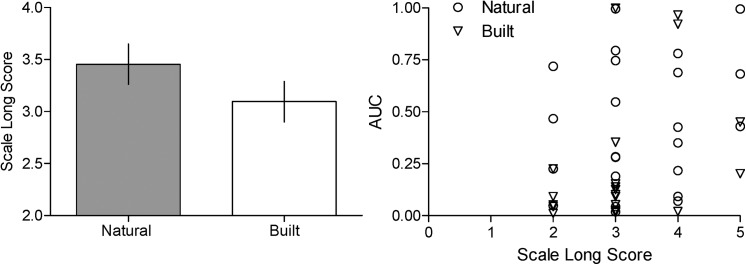
Fig 4. Score on the scale long task for the natural and built conditions (left panel) and scatter plot of AUC as a function of Scale Long Score (right panel).
Mean score on the 'scale long task' for the natural (filled bar) and built (open bar) conditions (left panel). Vertical lines represent the standard error of the mean. Scatter plot of AUC as a function of the Scale Long Score (right panel)—circles and triangles represent participant responses in the natural and built conditions, respectively.

