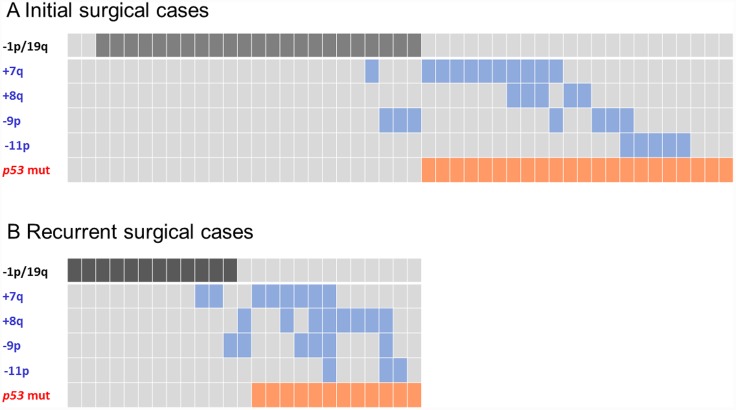
Fig 3. The correlation between TP53 mutations and the CNAs −1p/19q, +7q, +8q, −9p, and −11p in IDH mutant gliomas.
A comparison between (A) primary (n = 47) and (B) recurrent disease (n = 24). The CNA −1p/19q represents a favorable prognostic marker; the CNAs +7q, +8q, −9p, and −11p represents unfavorable prognostic markers.

