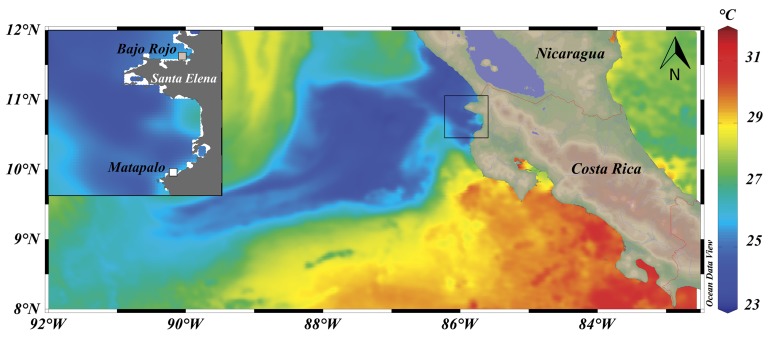
Fig 1. Upwelling event at the Pacific coast of Costa Rica on 17 February 2014.
Color scale in the water indicates sea surface temperature (SST). Shading on land indicates altitude; note the depression in the volcanic mountain range at Lake Nicaragua that enables Trade Wind crossing from the east. The inset shows the locations of study sites Matapalo (10°32’21”N, 85°45’59”W) and Bajo Rojo (10°57’26”N, 85°43’59”W). SST data were derived from a daily, global 1-km SST data set (GHRSST, Level 4, G1SST) produced by the JPL Regional Ocean Modeling System group [19], available at http://ourocean.jpl.nasa.gov/SST/ (accessed 09.12.2014). Data were visualized with the software Ocean Data View (Schlitzer, R., Ocean Data View, http://odv.awi.de, 2013).

