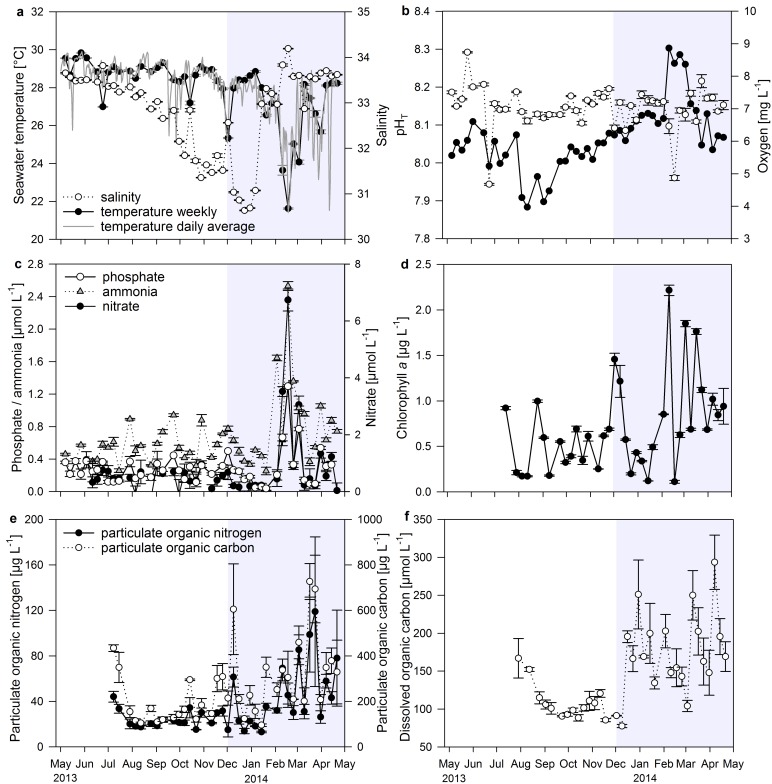
Fig 3. Changes in environmental parameters at Matapalo in a weekly resolution over 12 months.
(a) Seawater temperature (weekly data points measured with MANTA loggers and daily averages calculated from continuous HOBO logger data) and salinity; (b) pH value (total scale) and concentration of dissolved oxygen; (c) concentrations of inorganic nutrients phosphate, ammonia and nitrate; (d) concentration of chlorophyll a; (e) concentrations of particulate organic nitrogen and carbon; (f) concentration of dissolved organic carbon. Error bars indicate ± SE. Shaded area = upwelling period.

