. 2015 Nov 11;10(11):e0142443. doi: 10.1371/journal.pone.0142443

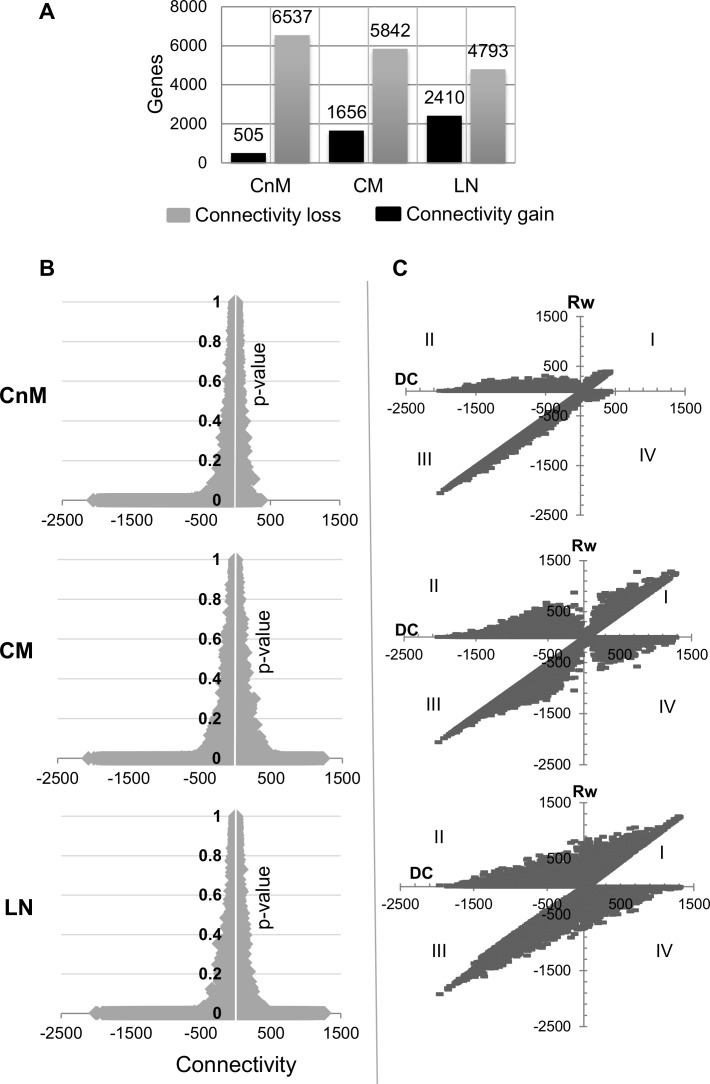
Fig 3. A. Number of genes significantly differentially connected (DC; either loss or gain) in each tumor stage with respect to the normal stage network. B. For each gene DC is plotted with its statistical significance (FDR adj.p-value) and with disease progression, number of genes with increased network connectivity increases under the significant p-value (p < 0.01) as revealed by horizontal line on the positive x-axis. C. For each gene, the calculated gained co-expression (Rw) is plotted with its overall DC score. The graph explains that with disease progression, genes tends to intensify the alterations in the connection types by gaining as well as loosing connections which may or may not alter its DC. Four quadrants suggest that genes may gain novel edges with increased DC (quadrant I) or gain novel connection despite losing overall DC (quadrant II) or lose edges with decreased DC (quadrant III) or show increased DC despite losing connections (quadrant IV). In the graph single gene was plotted two times to correlate Rw (+ve) versus DC and Rw (-ve) versus DC as both of the terms were found to be independent.

Fig 3