. 2015 Nov 11;10(11):e0142443. doi: 10.1371/journal.pone.0142443

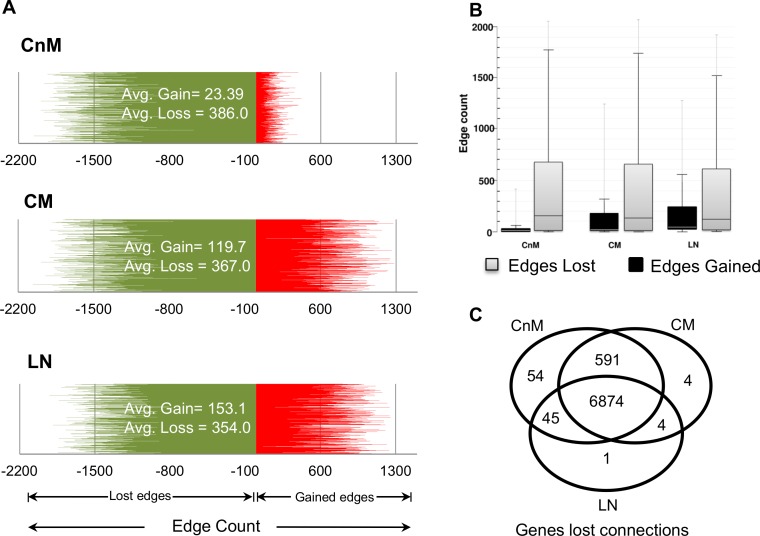
Fig 4. A. Line graph to observe the difference between edges lost (color: green) and gain (color: red) by a single gene in different melanoma stages. The observed trend suggests consistent and significant increase in novel edges gain, after the onset of metastasis. B. Boxplot showing the differences in the number of novel edges gained (color: red) and lost (color: green) by genes in each stage. C. Comparison for the genes that displayed connectivity loss (edge loss > 20) across different melanoma stages. Venn diagram suggests remarkable similarity of gene behavior across mutually exclusive datasets and loss of connections is a conserved phenomenon.

Fig 4