. 2015 Nov 11;10(11):e0142443. doi: 10.1371/journal.pone.0142443

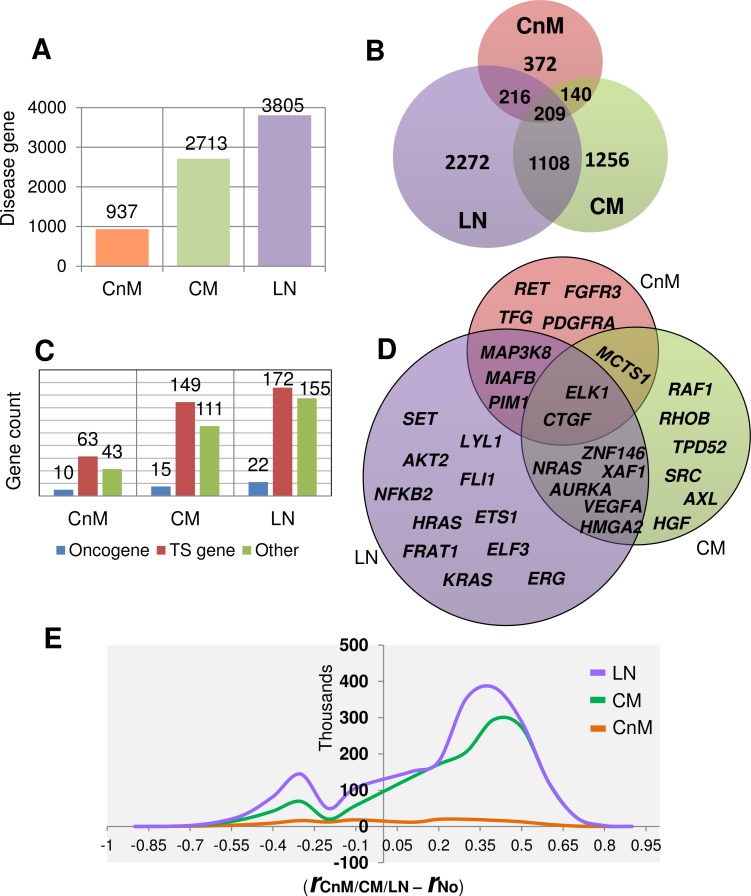
Fig 5. A. Total number of shortlisted putative disease genes with abnormal behavior (either up-regulated and/or network rewired) in each stage during melanoma progression. B. Number of shortlisted genes conserved across multiple stages which is comparatively many fold higher than DE genes alone. C. Number of different known tumor associated genes (tumor suppressor, oncogene and other tumor associated genes) identified among shortlisted disease genes for each stage. D. Oncogenes identified in each melanoma stage, the genes common in each stage are also displayed as intersections. E. Line graph showing the frequency of differential correlation coefficient observed for each edge between putative disease genes in each melanoma stage network versus control network. High value of differential correlation coefficient means high strength of association between disease genes in perturbed network as compared to normal.

Fig 5