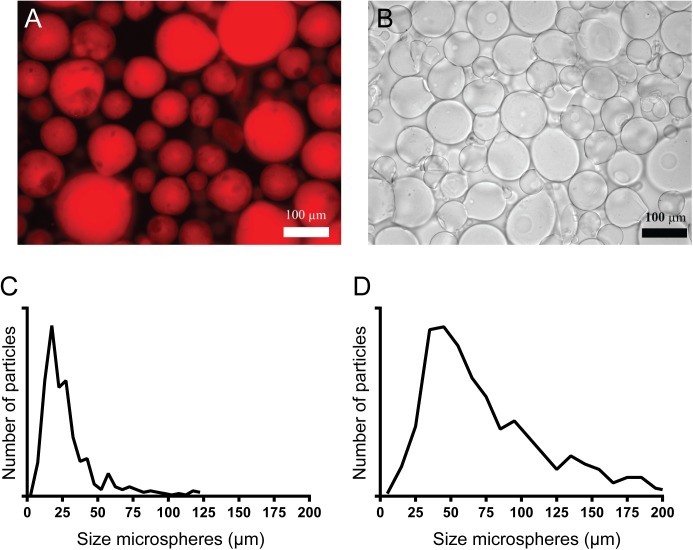
Fig 4. Microscopy images and size distribution of TSL-Ba-ms and Ho-ms.
Fluorescence microscopy image of TSL-Ba-ms (A) and bright-field microscopy image of alginate microspheres crosslinked with holmium ions (Ho-ms) (B) after sieving. The size distribution of TSL-Ba-ms before (C) and after (D) sieving was analyzed with calibrated BZ II Analyzer software.

